Gotta Go Fast
Don’t @ Me
No time for an intro because it’s time to go fast and when you’re going this fast you don’t have time to explain things or catch anyone up on what’s happening or edit out tpyos or even use punctuation let’s gooooooooooooooooooooo
Spaghetti Time
Everyone knew as soon as the latest P-score update came out that this post was coming. There were a couple items that immediately warranted deeper inspection:
No time for memes because there is a bomb attached to my keyboard that will explode if my WPM drops below 50, and typing out both of those links above from memory already came dangerously close to blowing up zink’s bus factor.
Where to look first? Obviously it’s gotta be that first one first, which means it’s Bioshock time.
Infinite (Perf)
I remember playing this game when it came out, and I remember it being fine. Benchmarking is about the same except it’s way harder to actually get into the benchmark mode for no obvious reason. According to Steam, the last time I ran this game for work was January of 2022; at that time, I remember having a weird bug where the rendering only progressed when I moved the mouse. Does that bug still exist?
Thankfully no, but the FPS is indeed low. Lower than I remembered. That’s good, because it meant I could bisect. And what did I find? Obviously it was a regression from this MR, which was causing some truly abysmal FPS in certain scenes (It turns out that doing a full GPU sync every time a query is used yields bad perf).
Specifically, the memory type check was broken. But great news: I “quietly” fixed this last week and nobody noticed.
Further benchmarking here yielded nothing actionable. On RadeonSI I was unable to repro anything remotely approaching the figures above—at most, I was able to get about half the claimed FPS. When switching to the Proton+DXVK mode, however, that’s around the performance I see.
I’m still not happy with the perf here, but I don’t think there’s much to be done at present; in my local testing I’m seeing an 8-9% perf gap, and it looks like some weird RADV corner case that I can’t examine further because RGP dumping is broken.
ET
This is another esoteric benchmark that I had to pull the actual cmdline out of ps while it was running because who even comes up with these things? Just give me a simple benchmark.sh script or something. I don’t wanna have to figure out ./etl.x86_64 '+exec preset_high +set ui_r_mode -1 +set r_fullscreen 0 +set r_mode -1 +timedemo 1 +set demodone quit +set demoloop1 demo etlegacy281-pts1; set nextdemo vstr demodone +vstr demoloop1 +vid_restart +set r_customwidth 1920 +set r_customheight 1080' 2>&1|grep fps.
Given the extremely high FPS here, it’s obvious that this benchmark is CPU-bound, and so it makes some sense as to why zink would have lower perf: a layered implementation using the same API is not going to match up with a native implementation in cases like this. But is the gap necessarily so large?
Initial results looked like this for me:
| GPU | FPS (RadeonSI) | FPS (zink) |
|---|---|---|
| RX5700 (primary) | 670 | 520 |
| 7900XTX (secondary) | 650 | 545 |
Clearly these are very different results than the above charts, but that’s benchmarking in a nutshell. Also weird is that radeonsi gets slower on the 7900 while zink+radv is faster? I don’t understand how sand thinks, but surely this makes sense to it.
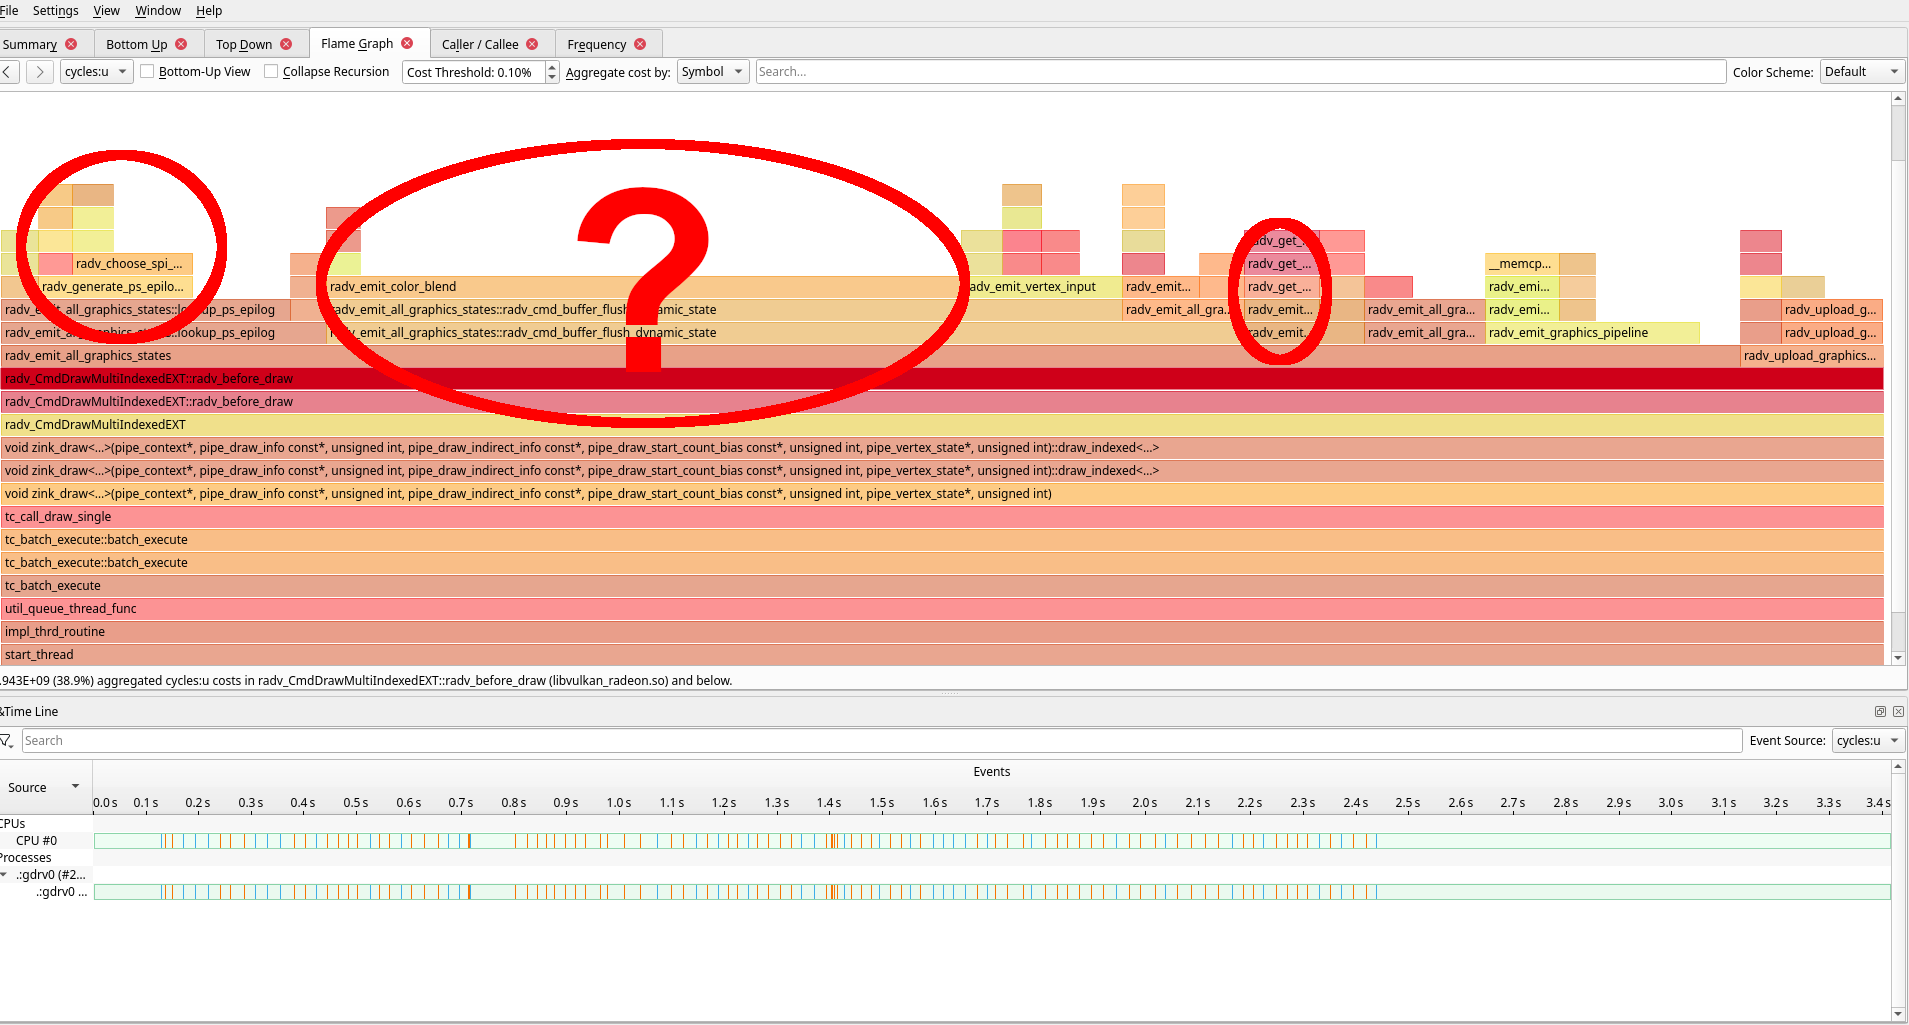
Let’s see what’s going on with perf:
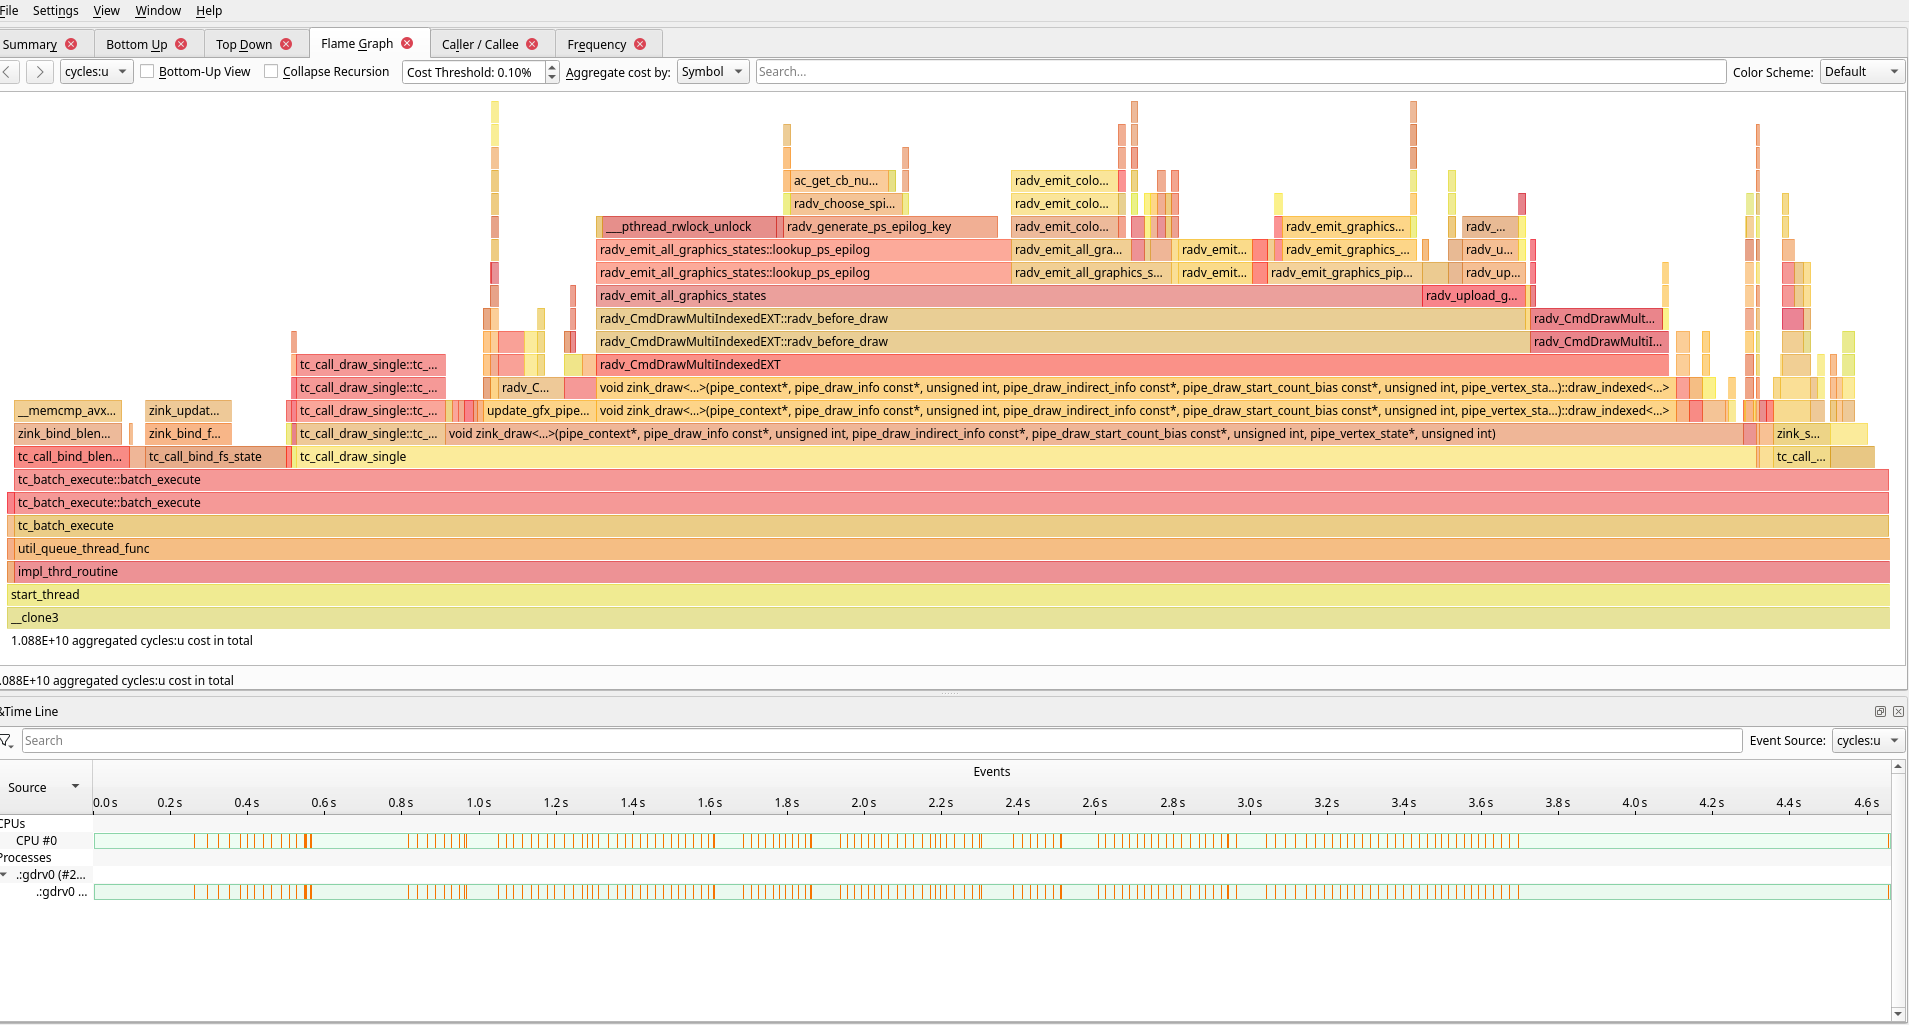
And, just at a glance, the problem area:
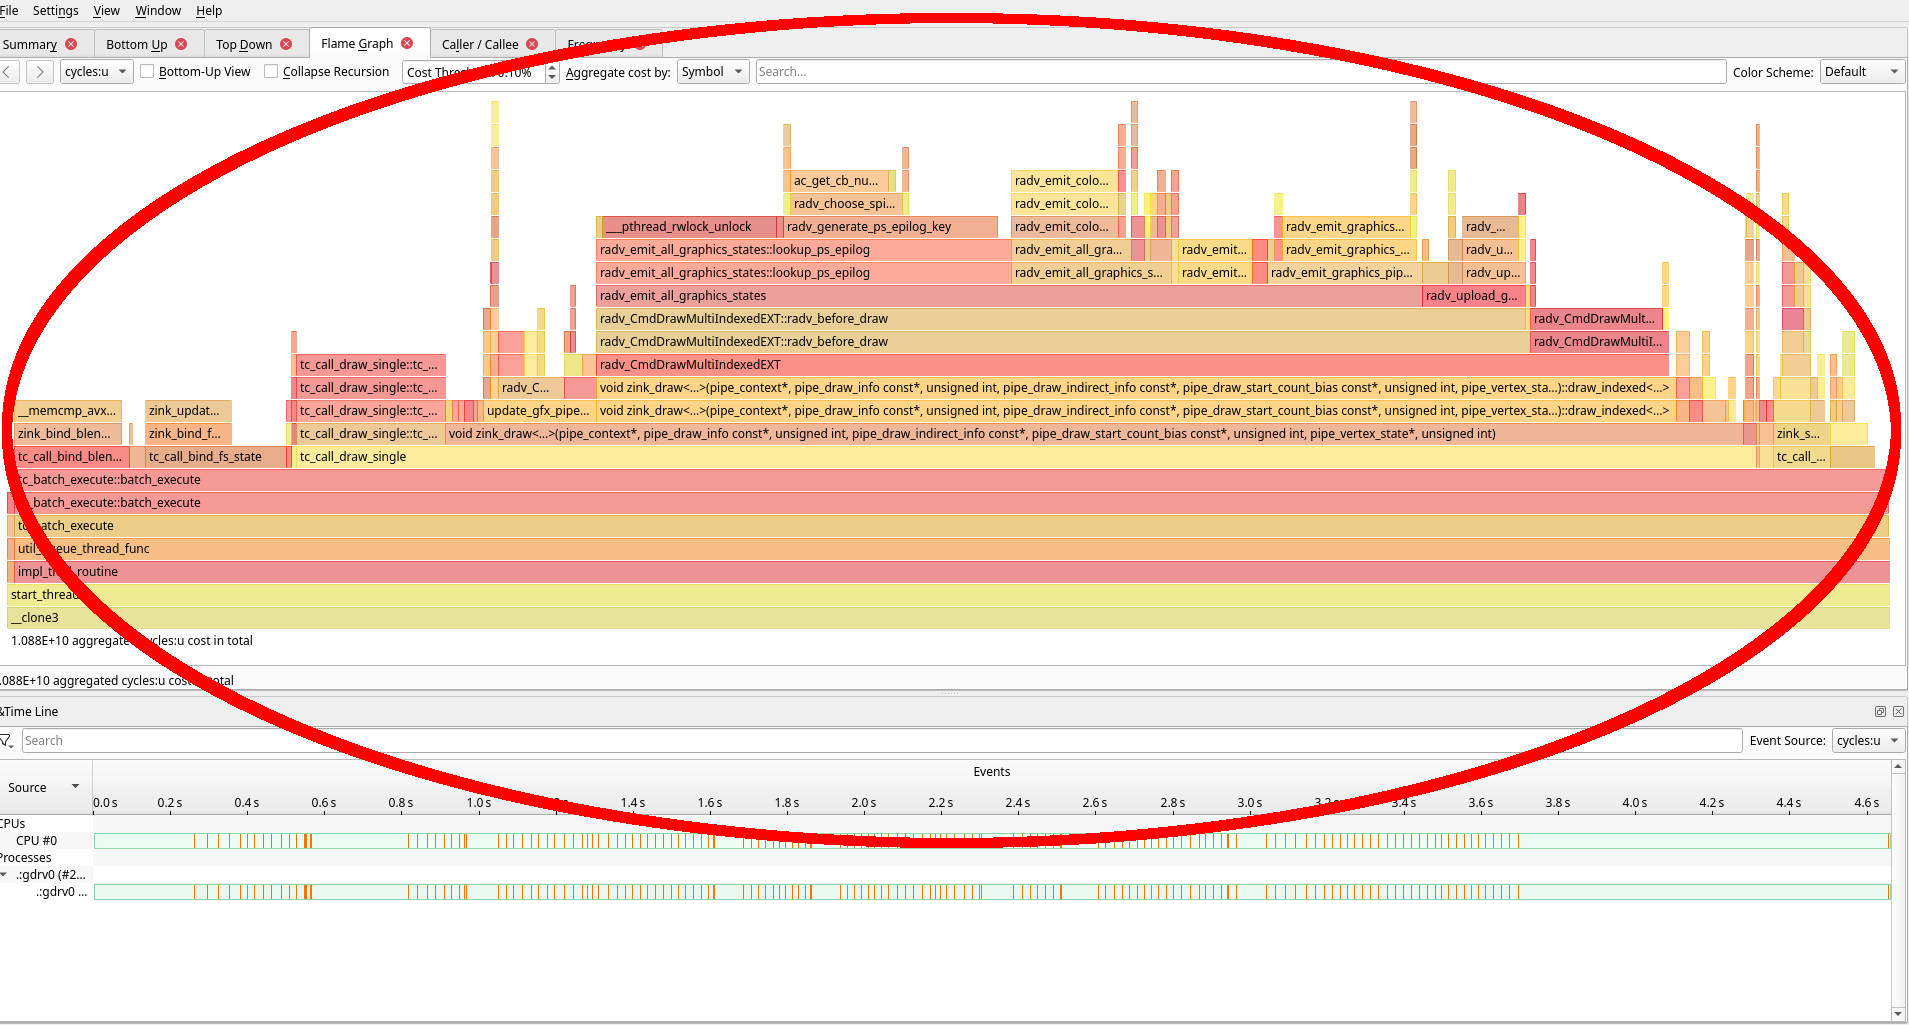
Well that’s not great.
ET Phone Faster
Taking out a magnifying glass, this resolves into some more definite problem areas:
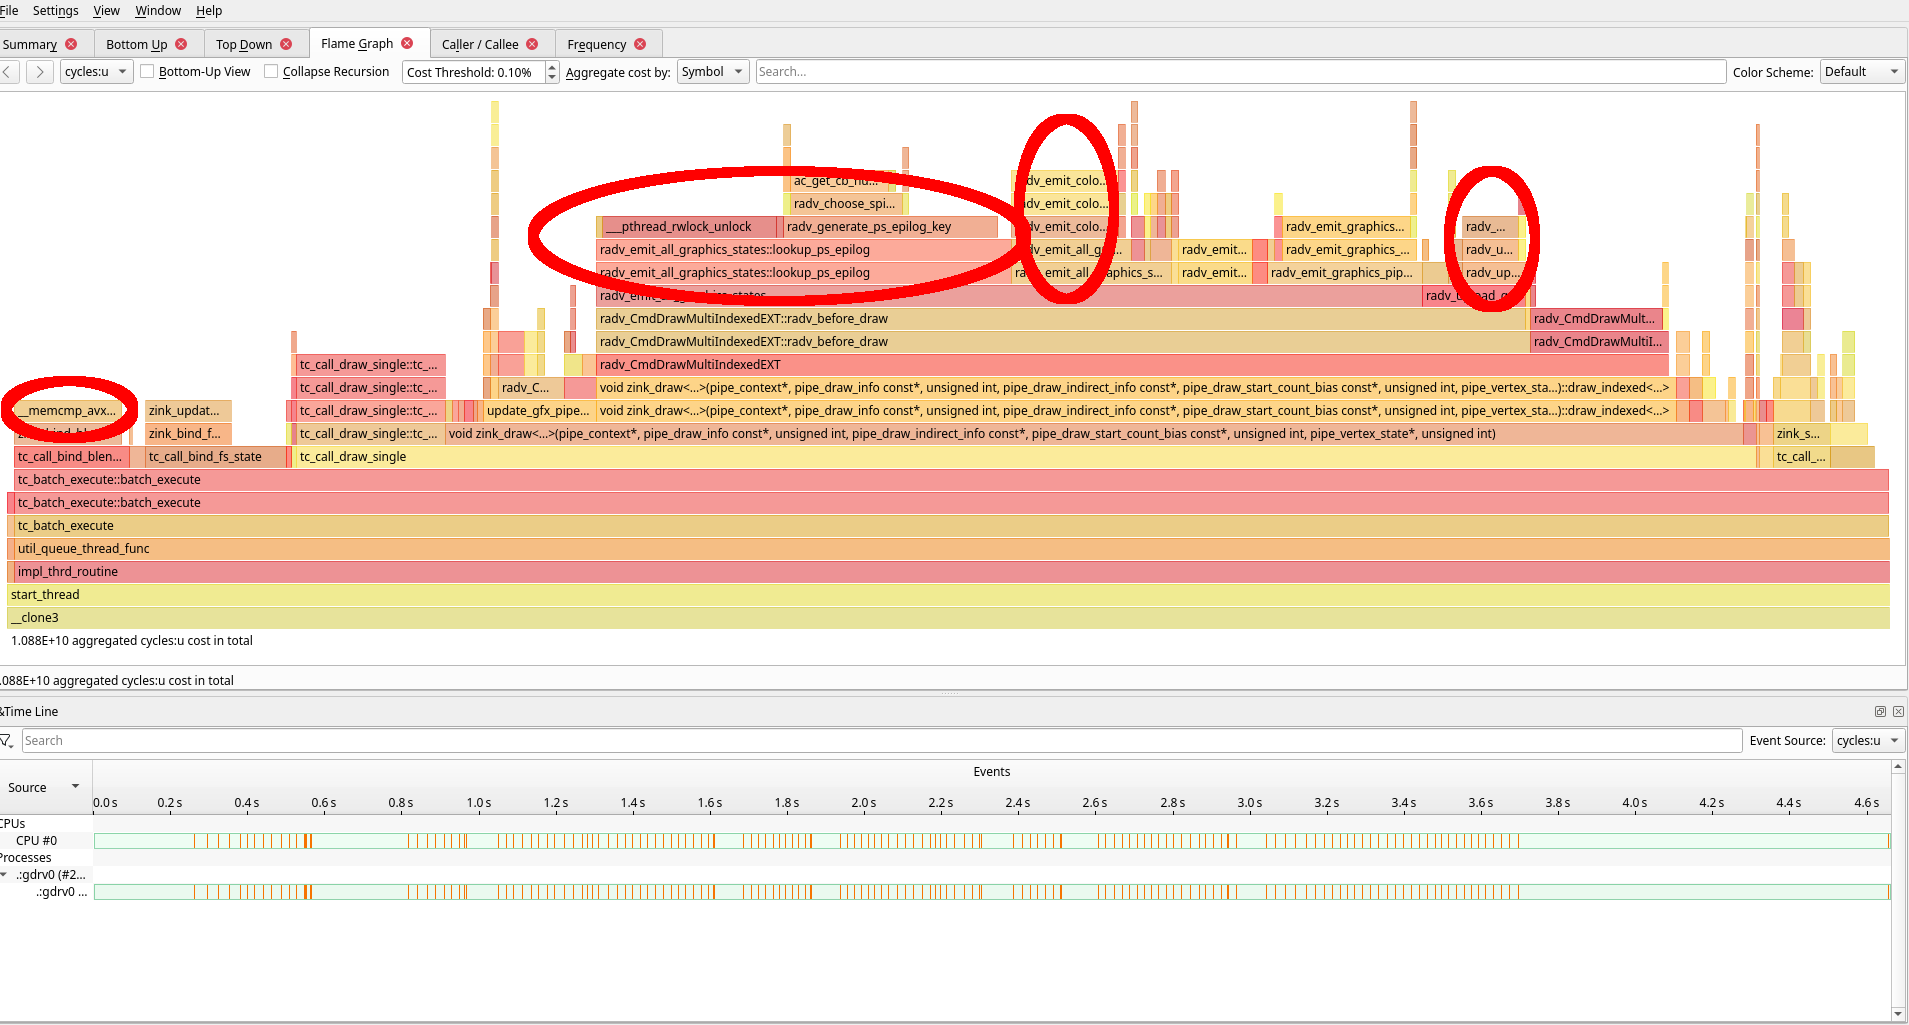
- PS epilog lookup (AKA dynamic blend)
- some other stuff
I banged out some epilog fixes, and then I did the same for VS prologs, and it’s great, and it’ll be up in MRs soon™. Huge perf gains. Absolutely massive. But only for zink, because nothing else uses any of this.
Where does that leave things in perf (zoomed for readability)?
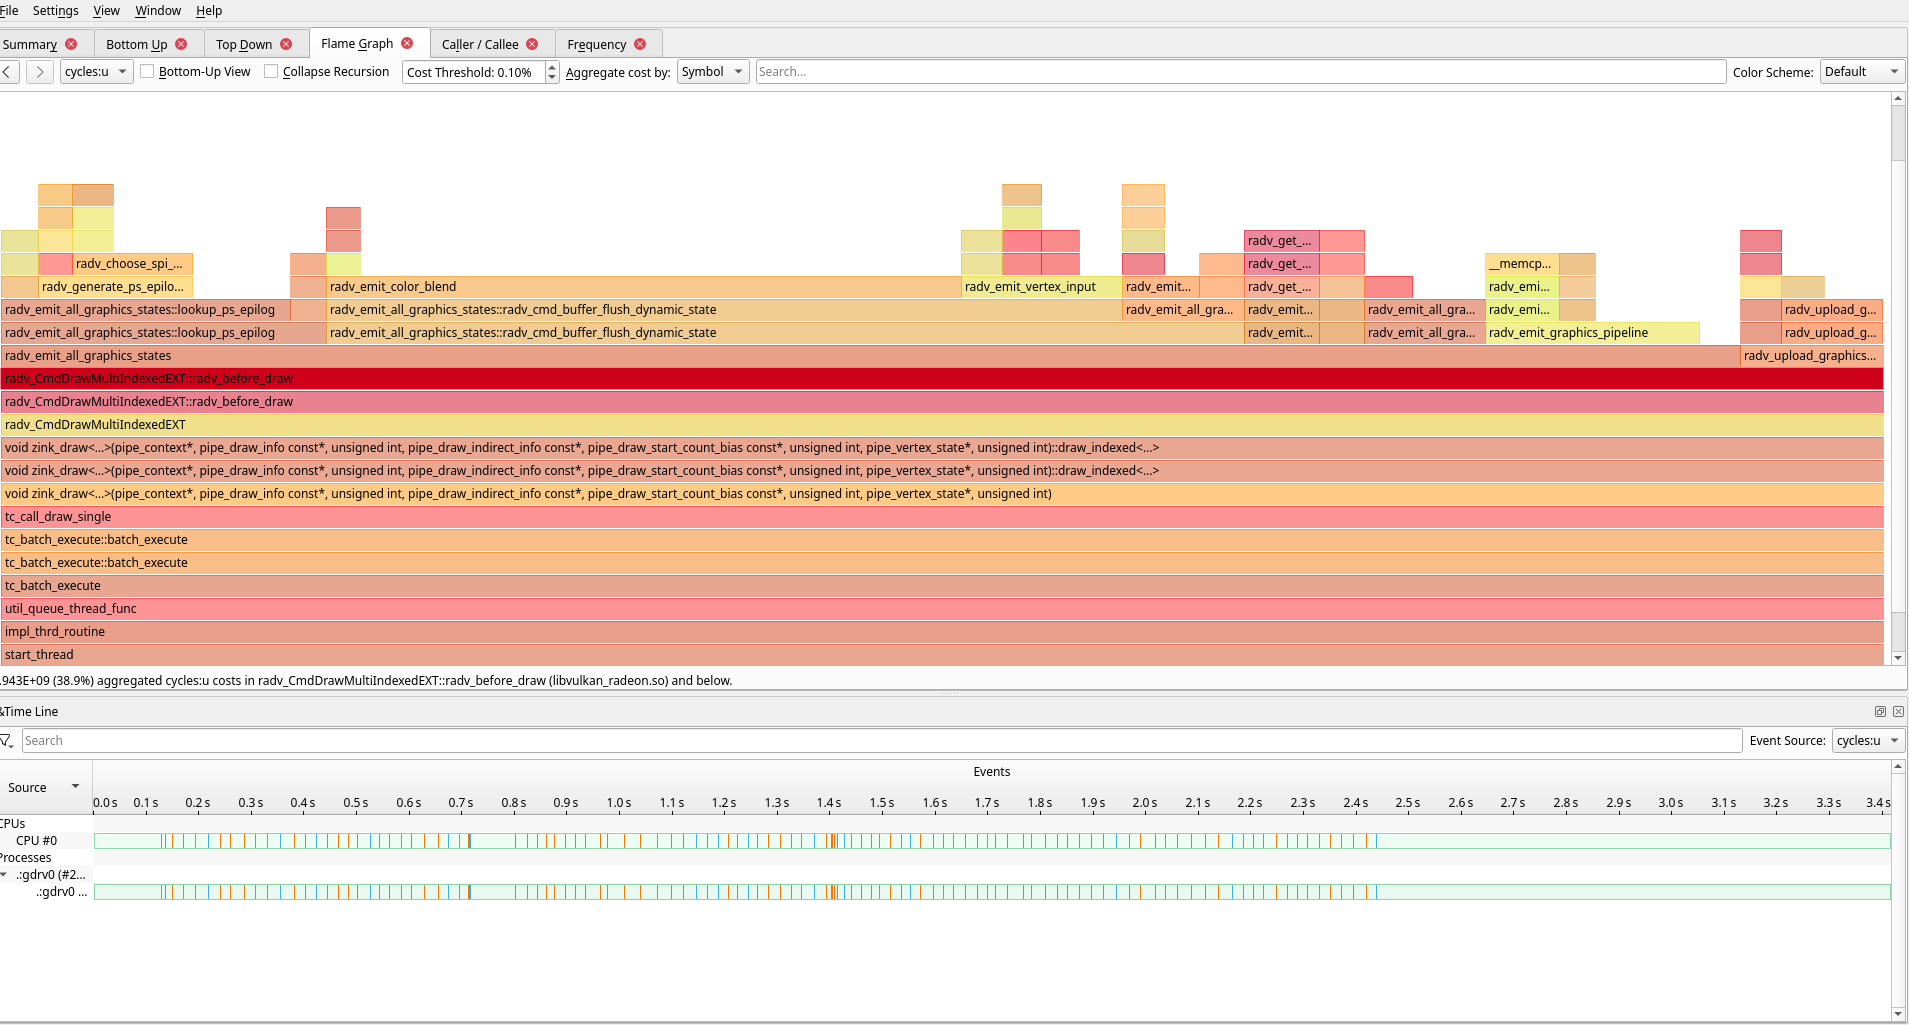
And the problems are…
Some of these are easily hammered out, and then there’s blend state emission. I tried a bunch of things, aaaaaaand it’s hard.
But progress was made, and suddenly now it’s like:
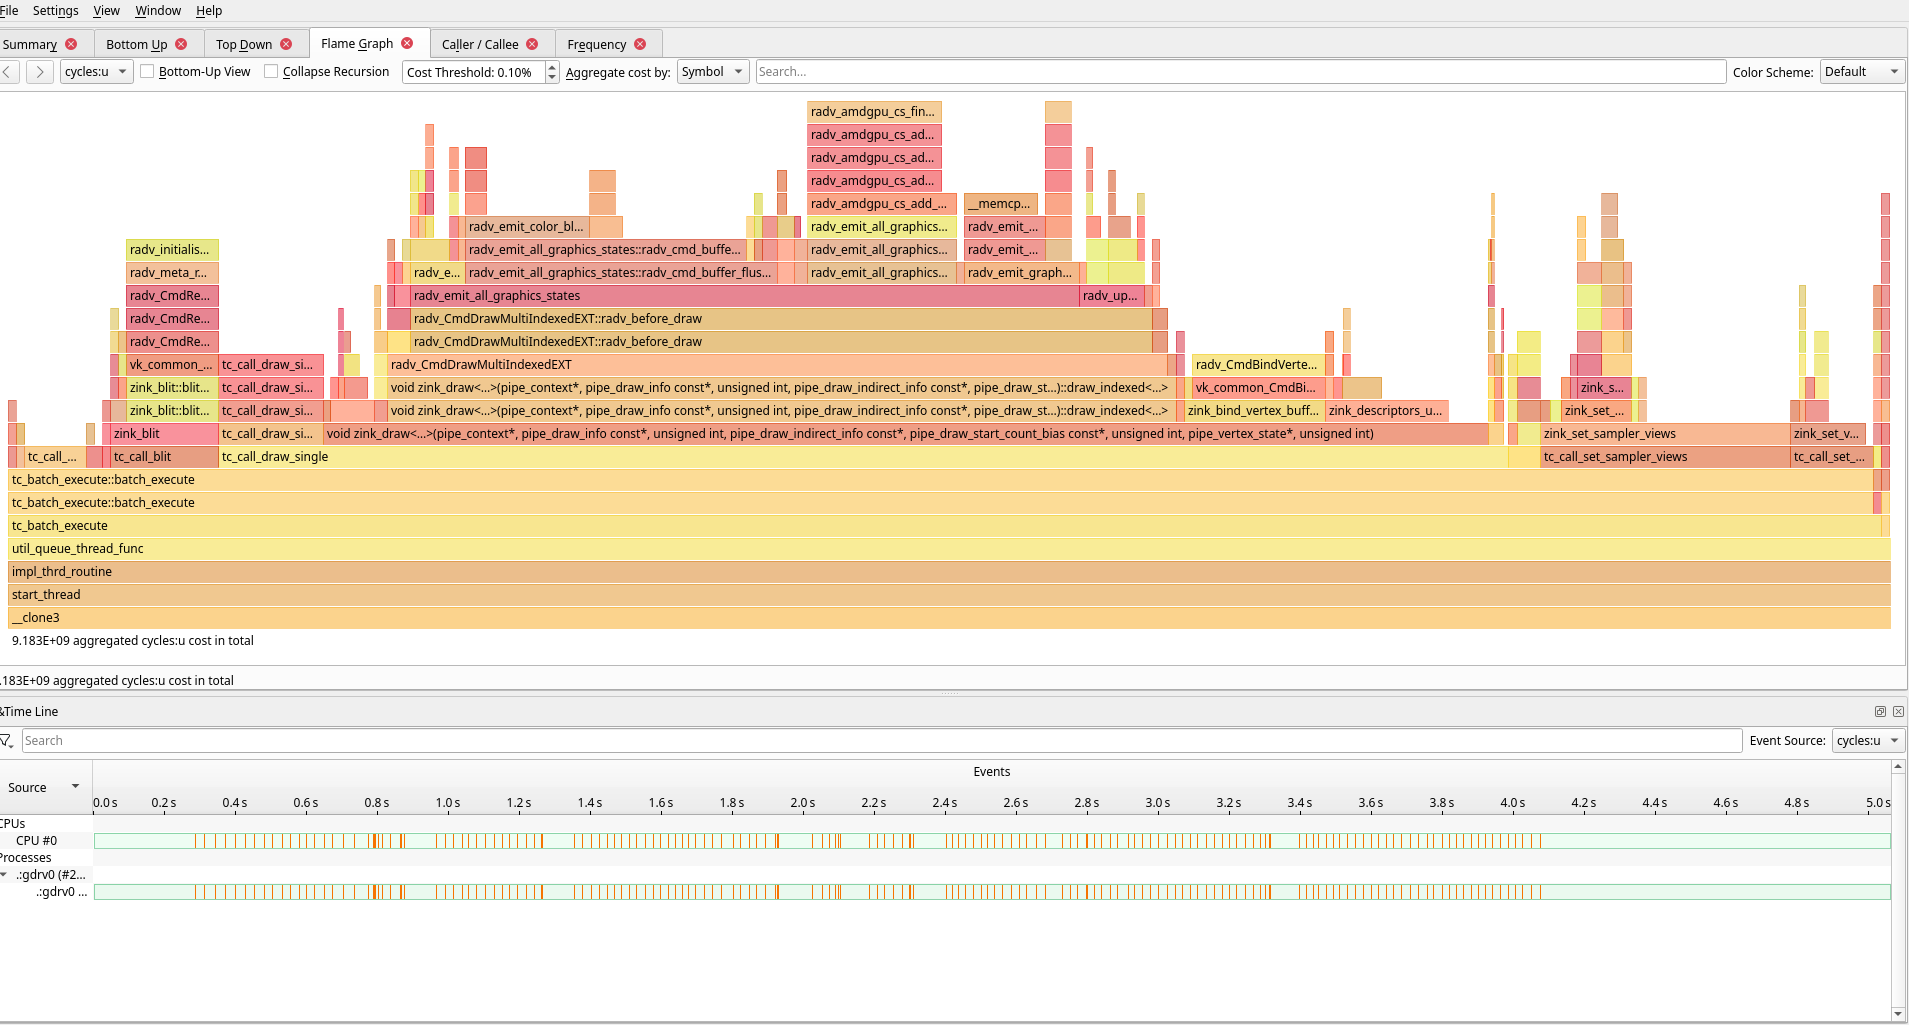
Which has a few weird things:
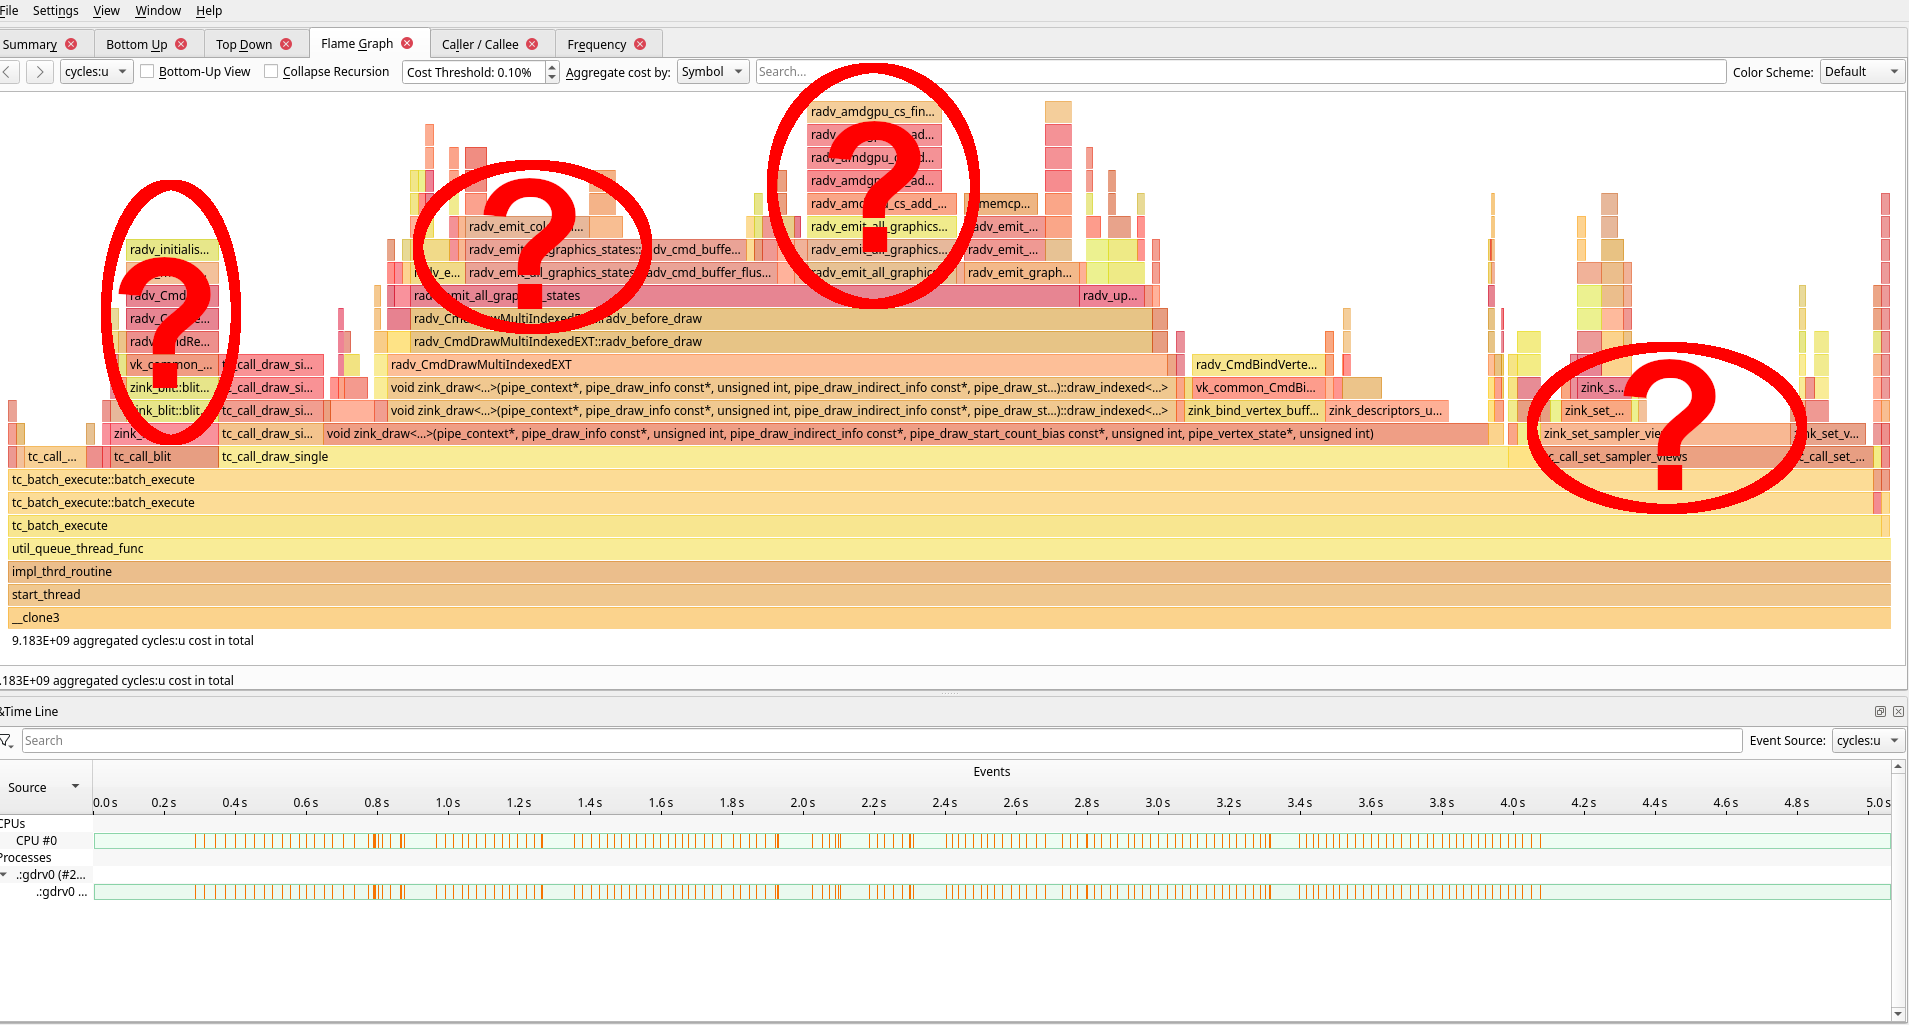
- surface init on resolves is “slow”
- blend emission is still somehow slow
- adding the CS buffer for the epilog is slow
- binding samplers in zink is slow
I haven’t been able to make too much headway on any of these, but they’re consistent in consuming a fair bit of CPU.
Final Results
Everyone knows that these results are going to be better, but how much better is the question.
It’s big, but it’s not that big.
| GPU | FPS (RadeonSI) | FPS (zink) |
|---|---|---|
| RX5700 (primary) | 670 | 580 |
| 7900XTX (secondary) | 650 | 545 |
I’m not sure what’s going on with my 7900, but I’m gonna assume there’s some weird quirk going on as a result of being a secondary GPU.
Overall, it amounts to roughly a 10% improvement, leaving the perf gap at around 14% between the two drivers. That’s not ideal, but it’s not terrible.