It’s been a while, but for the first time this year I have to do it. Some of you are shaking your heads, saying you knew it, and you were right. Here we are again.
It’s time to vkoverhead.
I realized while working on some P E R F that there was a lot of perf to be gained in places I wasn’t testing. That makes sense, right? If there’s no coverage, the perf can’t go up.
So I added a new case for the path I was using, and boy howdy did I start to see some weird stuff.
Normally this is where I’d post up some gorgeous flamegraphs, and we would sit back in our expensive leather armchairs debating the finer points of optimization. But you know what? We can’t do that anymore.
Why, you’re asking. The reason is simple: perf is totally fucking broken and has been for a while. But only on certain machines. Specifically, mine. So no more flamegraphs for you, and none for me.
Despite this massive roadblock, the perf gains must continue. Through the power of guesswork and frustration, I’ve managed some sizable gains:
| # | Draw Tests | 1000op/s (before) | % relative to ‘draw’ (before) | 1000op/s (after) | % relative to ‘draw’ (after) |
|---|---|---|---|---|---|
| 0 | draw | 46298 | 100.0% | 46426 | 100.0% |
| 16 | vbo change | 17741 | 38.3% | 22413 | 48.3% |
| 17 | vbo change dynamic (new!) | 4544 | 9.8% | 8686 | 18.7% |
| 18 | 1vattrib change | 3021 | 6.5% | 3316 | 7.1% |
| 20 | 16vattrib 16vbo change | 5266 | 11.4% | 6398 | 13.8% |
| 21 | 16vattrib change | 2352 | 5.1% | 2512 | 5.4% |
| 22 | 16vattrib change dynamic | 3976 | 8.6% | 5003 | 10.8% |
Though I was mainly targeting the case of using dynamic vertex input and binding new vertex buffers for every draw (and managed a nearly 100% improvement there) , I ended up seeing noteworthy gains across the board for binding vertex buffers, even when using fully static state. This should provide some minor gains to general RADV perf.
Given the still-massive perf gap between using static and dynamic vertex state when only vertex buffers change, it seems likely there’s still some opportunities to reclaim more perf. Only time will tell what can be achieved here, but for now this is what I’ve got.
]]>Karol Herbst. At SGC, we know this man. We fear him. His photo is on the wall over a break-in-case-of-emergency glass panel which shields a button activating a subterranean escape route set to implode as soon as I sprint through.
Despite this, and despite all past evidence leading me to be wary of any idea he pitched, the madman got me again.
cl_khr_image2d_from_buffer. On the surface, an innocuous little extension used to access a buffer like a 2D image.
Vulkan already has this support for 1D images in the form of VkBufferView, so why would adding a stride to that be any harder (aside from the fact that the API doesn’t support it)?
I was deep into otherworldly optimizations at this point, far beyond the point where I was able to differentiate between improvement and neutral, let alone sane or twisted. His words seemed so reasonable: why couldn’t I just throw a buffer to the GPU as a 2D image? I’d have to be an idiot not to be able to do something as simple as that. Wouldn’t I?
Dammit, Karol.

You can’t. I mean, I can, but you? Vulkan won’t let you do it. There’s (currently) no extension that enables a 2D bufferview. Rumor has it some madman on a typewriter is preparing to fax over an extension specification to add this, but only time will tell whether Khronos accepts submissions in this format.
Here at SGC, we’re all smart HUMANS though, so there’s an obvious solution to this.
It’s not memory aliasing. Sure, rebinding buffer memory onto an image might work. But in reading the spec, the synchronization guarantees for buffer-image aliasing didn’t seem that strong. And also it’d be a whole bunch of code to track it, and maybe do weird layout stuff, and add some kind of synchronization on the buffer too, and pray the driver isn’t buggy, and doesn’t this sound a lot like the we-have-this-at-home version of another, better mechanism that zink already has incredible support for?

Yeah. What about these things? How do they wORK?
A DMAbuf is basically a pipe. On one end you have memory. And if you yell TRIANGLE into the other end really loud, something unimaginable and ineffable that lurks deep withinthevoid will slitherand crawl its way up the pipeuntil it GAZES UPON YOU IN YOUR FLESHY MORTAL SHELL ATTEMPTING TO USURP THE POWERS OF THE OLD ONES. It’s a fun little experiment with absolutely no unwanted consequences. Try it at home!
The nice thing about dmabufs is I know they work. And I know they work in zink. That’s because in order to run an x̸̧̠͓̣̣͎͚̰͎̍̾s̶̡̢͙̞̙͍̬̝̠̩̱̞̮̩̣̑͂͊̎͆̒̓͐͛͊̒͆̄̋ȩ̶̡̨̳̭̲̹̲͎̪̜͒̓̈́̏r̶̩̗͖͙͖̬̟̞̜̠͙̠̎͑̉̌̎̍̑́̏̓̏̒̍͜͝v̶̞̠̰̘̞͖̙̯̩̯̝̂̃̕͜e̴̢̡͎̮͔̤͖̤͙̟̳̹͛̓͌̈̆̈́̽͘̕ŕ̶̫̾͐͘ or a Wayland compositor (e.g., Ŵ̶̢͍̜̙̺͈͉̼̩̯̺̗̰̰͕͍̱͊͊̓̈̀͛̾̒̂̚̕͝ͅḙ̵̛̬̜͔̲͕͖̜̱̻͊̌̾͊͘s̶̢̗̜͈̘͎̠̘̺͉͕̣̯̘̦͓͈̹̻͙̬̘̿͆̏̃̐̍̂̕ͅt̷̨͈̠͕͔̬̙̣͈̪͕̱͕̙̦͕̼̩͙̲͖͉̪̹̼͛̌͋̃̂̂̓̏̂́̔͠͝ͅơ̸̢̛̛̲̟͙͚̰͇̞̖̭̲͍͇̫̘̦̤̩̖͍̄̓́͑̉̿̅̀̉͒͋͒̂́̆̋̚͝ͅͅn̶̢̡̝̥̤̣͔̣͉͖̖̻̬̝̥̦͇͕̘͋͂͛̌̃͠ͅͅ, the reference compositor), dmabufs have to work. Zink can run both of those just fine, so I know there’s absolutely zero bugs. There can’t be any bugs. No. Not bugs again. NO MORE BUGS
Even better, I know that I can do imports and exports of dmabufs in any dimensionality thanks to that crazy CL-GL sharing extension Karol already suckered me into supporting at the expense of every Vulkan driver’s bug tracker. That KAROL HERBST guy, hah, he’s such a kidder!
So obviously–It’s just common sense at this point–Obviously I should just be able to hook up the pipes here. Export a buffer and then import a 2D image with whatever random CAUSALITY IS A LIE passes for stride. Right? Basically a day at the beach for me.

And of course it works perfectly with no problems whatsoever, giving Davinci Resolve a nice performance boost.
Stay sane, readers.
]]>I didn’t forget to blog. I know you don’t believe me, but I’ve been accumulating items to blog about for the past month. Powering up. Preparing. And now, finally, it’s time to begin opening the valves.
When I got back from hibernation, I was immediately accosted by a developer I’d forgotten. One with whom I spent an amount of time consuming adult beverages at XDC again. One who walks with a perpetual glint of madness in his eyes, ready at the drop of a hat to tackle the nearest driver developer and begin raving about the benefits of supporting OpenCL.
Obviously I’m talking about Karol “HOW IS THE PUB ALREADY CLOSED IT’S ONLY 10:30???” Herbst.
I was minding my own business, fixing bugs and addressing perf issues when he assaulted me with a vicious nerdsnipe late one night in January. “Hey, why can’t I run DaVinci Resolve on Zink?” he casually asked me, knowing full well the ramifications of such a question.
I tried to put him off, but he persisted. “You know, RadeonSI supports all those features,” he said next, and my entire week was ruined. As everyone knows, Zink can only ever be compared to one driver, and the comparisons can’t be too uneven.
So it was that I started looking at the CL CTS for the first time this year to implement cl_khr_gl_sharing. This extension is basically EXT_external_objects for CL. It should “just work”. Right?
The thing is, this mechanism (on Linux) uses dmabufs. You know, that thing we all love because they make display servers go vroom. dmabufs allow sharing memory regions between processes through file descriptors. Or just within the same process. Anywhere, really. One side exports the memory object to the FD, and the other side imports it.
But that’s how normal people use dmabufs. 2D image import/export for display server usage. Or, occasionally, some crazy multi-process browser engine thing. But still 2D.
You know who uses dmabufs with all-the-Ds? OpenCL.
You know who doesn’t implement all-the-Ds? Any Vulkan drivers. Probably. Case in point, I had to hack it in for RADV before I could get CTS to pass and VVL to stop screaming at me.
From there, it turned out zink mostly supported everything already. A minor bugfix and some conditionals to enable raw buffer import/export, and it just works.
Brace yourselves, because this is the foundation for getting Cthulhu-level insane next time.
]]>I got a ticket last year about this game Everspace having bad perf on zink. I looked at it a little then, but it was the end of the year and I was busy doing other stuff. More important stuff. I definitely wasn’t just procrastinating.
In any case, I didn’t fix it last year, so I dusted it off the other day and got down to business. Unsurprisingly, it was still slow.
The first step is always a flamegraph, and as expected, I got a hit:
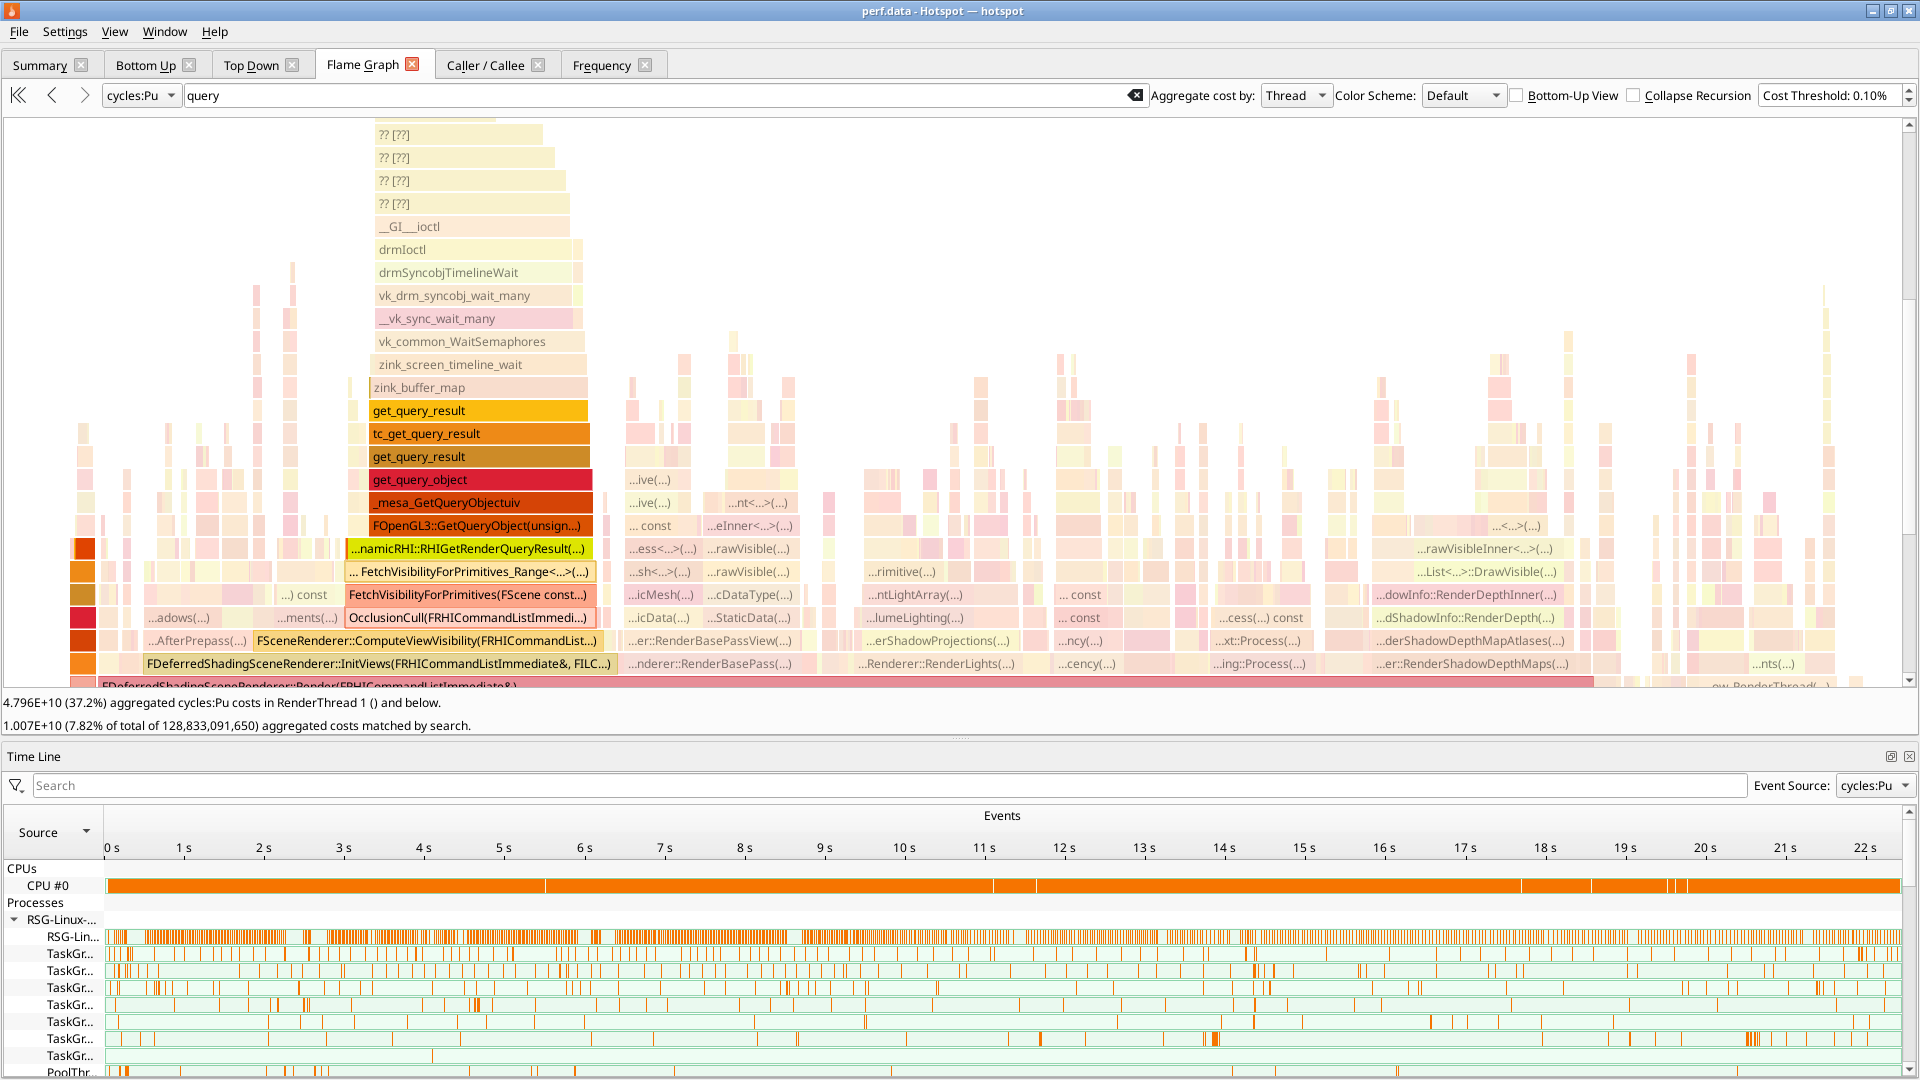
Huge bottlenecking when checking query results, specifically in semaphore waits. What’s going on here?
What’s going on is this game is blocking on timestamp queries, and the overhead of doing vkWaitSemaphores(t=0) to check drm syncobj progress for the result is colossal. Who could have guessed that using core Vulkan mechanics in a hotpath would obliterate perf?
Fixing this is very stupid: directly checking query results with vkGetQueryPoolResults avoids syncobj access inside drivers by accessing what are effectively userspace fences, which Vulkan doesn’t directly permit. If an app starts polling on query results, zink now uses this rather than its usual internal QBO mechanism.
Bottleneck uncorked and performance fixed. Right?
The perf is still pretty bad. It’s time to check in with the doctor. Looking through some of the renderpasses reveals all kinds of begin/end tomfoolery. Paring this down, renderpasses are being split for layout changes to toggle feedback loops:
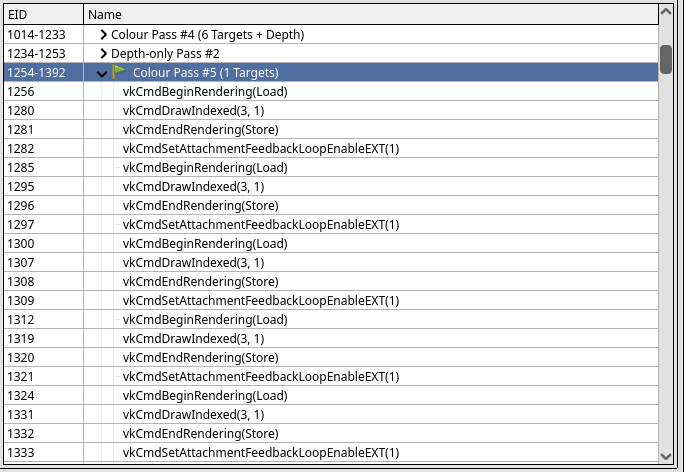
The game is rendering to one miplevel of a framebuffer attachment while sampling from another miplevel of the same image. This breaks zink’s heuristic for detecting implicit feedback loops. Improvements here tighten up that detection to flatten out the renderpasses.
Perf recovered: the game runs roughly 150% faster, putting it on par with RadeonSI. Maybe some other games will be affected? Who can say.
]]>Don’t quote me. We’re not doing it.
Unless we are, in which case everything I wrote last year may come to pass with the advent of the unified OpenGL/ES ‘25 release. This is not a release announcement, but I’m tentatively planning to provide the date of the announcement once the ray-tracing EXT goes live.
Confused? Well, you better figure it out quick cuz this is only the first week of 2025 and we got 51 more to go.
In the meanwhile, get in the car: we’re going mesh shading.
I gotta do this every year because we can’t have fun anymore on the internet. C’mon. Obviously there’s no ray-tracing EXT in the pipe BECAUSE WE’RE GOING MESH SHAAADIIIIIIIIIIIIIIIIIIII
]]>Last week was XDC. I did too much Wayland, and now I’ve been stricken with a plague for my hubris.
I have some updates, but I lack the ability to fully capture the exploits of Mesa’s most sane developer in the ten minutes I’m awake every day. In the meanwhile, let’s take a look another potential example of great hubris.
Have you ever made a decision that seemed great at the time but then you realized later it was actually maybe not that great? Like, maybe it was actually really, uh, well, not dumb since nobody reading this blog would do something like that, but not…smart. And everyone else was kinda going along with your decision and trusting that you knew what you were talking about because let’s face it, you’re smart. Everyone knows how smart you are. That’s why they trust you to make these decisions.
Long-time SGC readers know I’m not one to make decisions of any kind, but we all remember that time Microsoft famously introduced Work Graphs to D3D and also (quietly) deprecated ExecuteIndirect. The argument was compelling: why not just move all the work to the GPU?
Haters described Work Graphs as just another attempt by the driver cartel to blame bugs on app developers by making tooling impossible. The rest of us were all in—We jumped on that bandwagon like it was the last triangle in the pipe before a crash. It wasn’t long before the high-powered players were aboard:
Details were light at this stage. There were no benchmarks, no performance numbers, no games or applications using Work Graphs, but everyone trusted Microsoft. Everyone knew the idea of this tech was sound, that it had to be faster.
Microsoft doubled down: Work Graphs would support mesh nodes for drawing!
Other graphics wizards began to get involved. The developerverse was in a tizzy. Everyone wanted in on the action.
The hype train had departed the station.
Six months after GDC, the first notable performance figures for Work Graphs were blogged about by AAA graphics rockstar, Kostas Anagnostou. I was at a Khronos F2F when it happened, and the number of laptop screens open to the post when it dropped was nonzero. Very nonzero.
At best, the figures were whelming.
Still there was no real analysis of Work Graph performance in comparison to alternative solutions. Haters will say I’m biased after recently shipping Vulkan’s device generated commands extension, but this was going to ship regardless since vkd3d-proton requires cross-vendor compatibility for ExecuteIndirect functionality used in games like Halo Infinite and Starfield. I’m all about the numbers. Show me the graphs. The perf graphs, that is.
Fortunately, friend of the blog and veteran vertex wrangler, Hans-Kristian Arntzen, always has my back. He’s spent the past few months heroically writing vkd3d-proton emulation for Work Graphs, and he has recently posted his findings to an obscure README in that repository.
READ IT. SERIOUSLY. YES, THIS IS A FULL PAGE-WIDTH LINK SO YOU CAN’T POSSIBLY MISS IT.
If you’re just here for the quick summary (which you shouldn’t be considering how much time he has spent making charts and graphs, and taking screenshots, and summing everything up in bite-sized morsels for easy consumption):
The principle of charity requires taking serious claims in the best possible light. This should have yielded robust, powerful ExecuteIndirect benchmark usage (and even base compute/mesh shader usage) to provide competitive benchmarks against Work Graph functionality. At the time of writing, those benchmarks have yet to materialize, and the only test cases are closer to strawmen that can be held up for an easy victory.
I’m not saying that Work Graphs are inherently bad.
Yet.
At this point, however, I haven’t seen compelling evidence which validates the hype surrounding the tech. I haven’t seen great benchmarks and demos. Maybe it’s a combination of that and still-improving driver support. Maybe it’s as-yet available functionality awaiting future hardware. In any case, I haven’t seen a strong, fact-based technical argument which proves, beyond a doubt, that this is the future of graphics.
Before anyone else tries to jump on the Work Graph hype train, I think we owe it to ourselves to thoroughly interrogate this new paradigm and make sure it provides the value that everyone expects.
]]>I wake at 5 AM. This is the perfect time to wake up in NYC TZ, as it affords me the ability to eat a whole apple in the time it takes my little internet-browsing chromebook to load all the IRC and Discord backlogs from the five hours that I snuck away for a nap when nobody was watching.
I slather the apple with a haphazard scoop of peanut butter; getting away from a keyboard for more than twenty six
seconds in a given stretch is difficult, and I need protein. While entering into a fraught negotiation over
the meaning of 30-day discussion period with my left hand, I carefully scoop protein powder into a shaker with my right.
There’s no time to waste. Not even a single second–Another argument could break out, steal a 1973 Pontiac Firebird, and
go joyriding on the wrong side of the freeway.
I’m writing this blog post with my toes. They know their way around a keyboard, but they’re slow and prone to mistakes. My cat is in charge of hitting an oversized backspace key when I dangle his favorite toy over it. It’ll be hours before we get something together that can be read coherently.
This is my life now.
This is what it takes to do Open Source.
I’ve put up a couple sizable proposals to resolve longstanding issues and oversights in the governance model. Today is Friday, however, which means it’s the final day. Once we hit the weekend, everyone will collectively fuck off and forget everything that happened this week, which means I have to maintain peak velocity and finish strong.
Let’s fucking go.
It’s a great question. I asked it myself. The answers are myriad and nebulous, but I’m the guy who explains things, so I’m gonna break it down.
Imagine you’re wayland-protocols. You’ve got all these puppies. And you’re walking them–so you tell yourself, but really they’re walking themselves. They’re walking you. And they’re going in whatever direction they want. And out of all these puppies you’ve got two, one’s trying to go left to chase a car, and the other one’s trying to sniff a telephone pole on the right. The other fifty seven puppies just want to keep moving because they love their walkies. But these two puppies are the biggest ones, and they’re pulling the others along with them. So now your leashes are getting all tangled, and you’re being dragged around, and everyone’s pointing at you because you look like you don’t know what you’re doing.
That’s where we’re at now. Everyone’s laughing at you.
Look at this idiot trying to walk fifty nine puppies at once. This absolute moron. Who would ever do that? Why not just walk one or maybe two puppies at a time like everyone else? That’s the way you’re supposed to walk them. The way people have always walked them.
But you know what? Walking fifty nine puppies individually would take all day. Nobody has the time to walk fifty nine puppies individually no matter how cute or eloquent they are. So you need some way to resolve this. Or something.
Look, you get where I’m going with this.
Wayland protocol discussions get bogged down by people throwing out hypotheticals that can’t truly be resolved, or by people talking past each other, or by people disappearing, or the phase of the moon, or any number of reasons, and there’s no official way to get past these blockages. That’s why I’m proposing tie-breaker votes as a simple way of moving past these problems when they arise.
Everyone understands tie-breakers: you vote, and the side with the most votes wins. It’s that simple.
In this context, the wayland-protocols member projects vote (with one of them representing the author for non-members) and the majority wins. If there’s another tie, the author gets to break it.
Simple. Done.
Sometimes a protocol in staging/ is “good enough”. The author has checked out, people are using the protocol,
and everyone is happy with it.
But it’s still not a stable/ protocol.
In this scenario, after an extended period of time without changes, any staging/ protocol can be nominated by a
member project for stable/ promotion.
Some discussion happens, and then it becomes stable.
Simple. Done.
The governance model talks about discussion periods, but it doesn’t specify exactly when they begin. For example, on any of my governance MRs, does the 30-day period start when I open the MR or when the MR is approved?
Obviously it starts when I open the MR. We gotta keep things moving.
Done.
The governance document specifies that a member project may have up to two official representatives. This can be problematic, as it puts pressure on 1-2 people to be on top of every active protocol discussion.
Instead, projects should be represented by as many individuals as they want (pending the usual process for adding points-of-contact). This ensures that protocols don’t get blocked waiting for a given project to take a look when all representatives are busy. It also helps more diverse projects (e.g., wlroots) ensure that opinions from more of its constituents are officially represented.
Each project still only gets one vote, but now that vote can be more readily deployed and voiced.
From what I’ve seen, this should cover all the major issues that have been negatively impacting Wayland development. Sure, there are other, more minor issues, but I’m not aware of anything that can’t be solved through good old person-to-person discussion.
Maybe all this works, and maybe it doesn’t. But at least now if we decide to throw away some puppies, nobody can question whether we really tried everything.
]]>While other development has been progressing, in the background I’ve been working on something big. Now, finally, I can talk about it.
VK_EXT_device_generated_commands is a new extension which, it’s no exageration to say, is the biggest thing Vulkan has shipped since ray-tracing. I had the privilege of working with people across the industry while driving it, from both desktop and mobile hardware vendors, and despite it being EXT, we’re going to see some truly broad adoption here.
Big shoutout to Patrick Doane, formerly of Activision-Blizzard and now (I think) at Deviation Games, for kickstarting this many years ago. Thanks for your work. I hope you’re satisfied with the final product.
DGC enables applications to record commands from shaders to then be executed directly. This means no more ping-ponging back and forth between CPU and GPU, which can help to eliminate performance bottlenecks. See also the NV extension and D3D12 ExecuteIndirect as prior art.
While this functionality is used in big games such as Starfield and Halo Infinite, those examples are ETOOBIG to really comprehend. Also the code is proprietary, so I can’t share it publicly. Also I don’t have the code.
Fortunately, I’ve hacked together a small demo program for people to look over to get a feel for the functionality.
dgcgears is a rough fork of vkgears from mesa-demos (thanks to zink’s own godfather, Erik Faye-Lund for the original work!) which utilizes DGC to execute draws rather than record them directly.
Now here’s where the crazy stuff starts.
EXT DGC adds the ability to change shaders from shaders. By creating an Indirect Execution Set, multiple sets of shaders can be bundled together and indexed into from within shaders. dgcgears uses a different vertex shader to draw each gear.
While the NV extension had this functionality, EXT takes it further, enabling it to be supported on all hardware.
Another big feature of EXT DGC is that it is agnostic to pipelines vs shader objects vs whatever new stuff comes out in the future. If you prefer one over the other, you’re free to go ahead and use that.
I’ve already written the code, and it should land at some point.
Device. Generated. Commands.
Count ‘em.
]]>