Apitrace Goes Vroom
First Time
Today marks the first post of a type that I’ve wanted to have for a long while: a guest post. There are lots of graphics developers who work on cool stuff and don’t want to waste time setting up blogs, but with enough cajoling they will write a single blog post. If you’re out there thinking you just did some awesome work and you want the world to know the grimy, gory details, let me know.
The first victimrecipient of this honor is an individual famous for small and extremely sane endeavors such as descriptor buffers in Lavapipe, ray tracing in Lavapipe, and sparse support in Lavapipe. Also wrangling ray tracing for RADV.
Below is the debut blog post by none other than Konstantin Seurer.
What is apitrace?
Apitrace is a powerful tool for capturing and replaying traces of GL and DX applications. The problem is that it is not really suitable for performance testing. This blog post is about implementing a faster method for replaying traces.
About six weeks ago, Mike asked me if I wanted to work on this.
[6:58:58 pm] <zmike> on the topic of traces
[6:59:08 pm] <zmike> I have a longer-term project that could use your expertise
[6:59:19 pm] <zmike> it's low work but high complexity
[7:00:12 pm] <zmike> specifically I would like apitrace to be able to competently output C code from traces and to have this functionality merged upstream
low work
Sure. 
The state of glretrace
This first obvious step was measuring how glretrace currently performs. Mike kindly provided a couple of traces from his personal collection, and I immediately timed a trace of the only relevant OpenGL game:
$ time ./glretrace -b minecraft-perf.trace
/Users/Cortex/Downloads/graalvm-jdk-23.0.1+11.1/bin/java
Rendered 1261 frames in 10.4269 secs, average of 120.937 fps

real    0m10.554s
user    0m12.938s
sys     0m2.712s
This looks fine, but I have no idea how fast the application is supposed to run. Running the same trace with perf reveals that there is room for improvement.
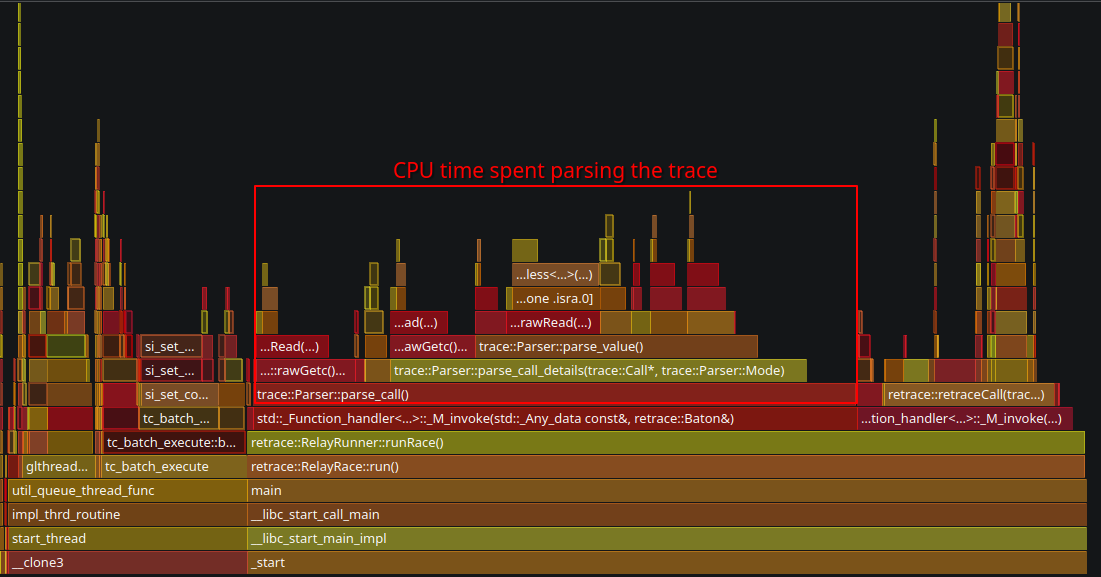
2/3 of frametime is spent parsing the trace.
Implementation
An apitrace trace stores API call information in an object-oriented style. This makes basic codegen really easy because the objects map directly to the generated C/C++ code. However, not all API calls are made equal, and the countless special cases that I needed to handle are what made this project take so long.
glretrace has custom implementations for WSI API calls, and it would be a shame not to use them. The easiest way of doing that is generating a shared library instead of an executable and having glretrace load it. The shared library can then provide a bunch of callbacks for the call sequences we can do codegen for and Call objects for everything else.
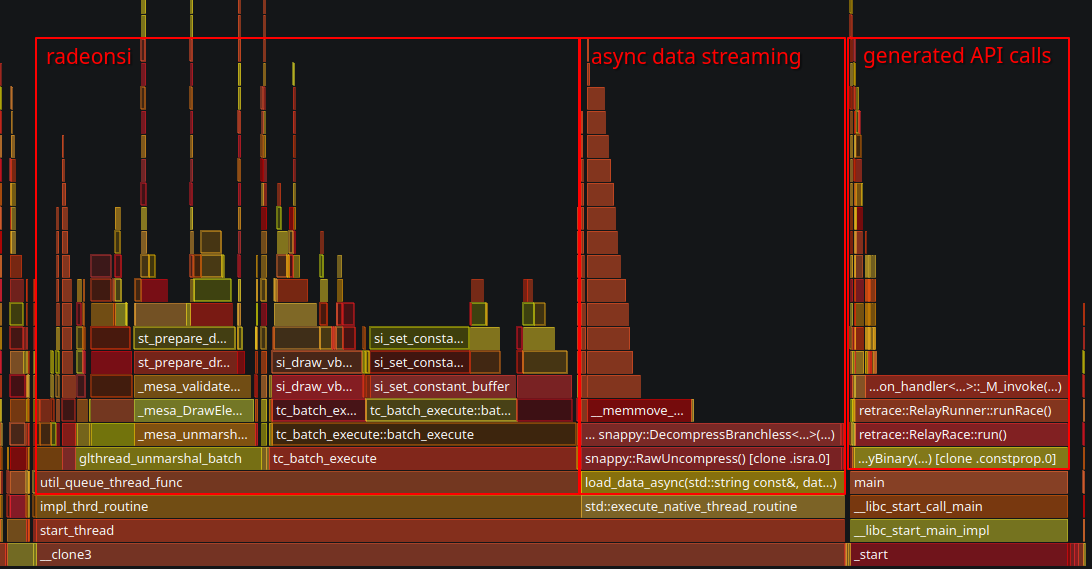
Besides WSI, there are also arguments and return values that need special treatment. OpenGL allows the application to create all kinds of objects that are represented using IDs. Those IDs are assigned by the driver, and they can be different during replay. glretrace remaps them using std::maps which have non-trivial overhead. I initially did that as well for the codegen to get things up and running, but it is actually possible to emit global variables and have most of the remapping run logic during codegen.
Data streaming
With the main replay overhead being taken care of, a major amount of replay time is now spent loading texture and buffer data. In large traces, there can also be >10GiB of data, so loading everything upfront is not an option. I decided to create one thread for reading the data file and nproc decompression threads. The read thread will wait if enough data has been loaded to limit memory usage. Decompression threads are needed because decompression is slower than reading the compressed data.
codegen in action
The results speak for themselves:
$ ./glretrace --generate-c minecraft-perf minecraft-perf.trace
/Users/Cortex/Downloads/graalvm-jdk-23.0.1+11.1/bin/java
Rendered 0 frames in 79.4072 secs, average of 0 fps
$ cd minecraft-perf
$ echo "Invoke the superior build tool"
$ meson build --buildtype release
$ ninja -Cbuild
$ time ../glretrace build/minecraft-perf.so
info: Opening 'minecraft-perf.so'... (0.00668795 secs)
warning: Waited 0.0461142 secs for data (sequence = 19)
Rendered 1261 frames in 5.19587 secs, average of 242.693 fps

real    0m5.415s
user    0m5.429s
sys     0m4.983s
Nice.
Looking at perf most CPU time is now spent in driver code or streaming binary data for stuff like textures on a separate thread.
If you are interested in trying this out yourself, feel free to build the upstream PR and report on bugs unintended features. It would also be nice to have DX support in the future, but that will be something for the dxvk developers unless I need something to procrastinate from doing RT work.
- Konstantin