Big Lifts
New Record
For months now I’ve been writing increasingly unhinged patchsets. Sometimes it might even seem like there is no real point to what I’m doing. Or that I’m just churning code to have something to do.
But I’m here today to tell you that finally, the long journey is over.
We have reached the promised land of perf.
Huge.
Many months ago, I began examining viewperf, AKA the final frontier of driver performance. What makes this the final frontier? some of you might be asking.
Imagine an application which does 10,000 individual draws per frame, each with their own vertex buffer bindings. That’s a lot of draws.
Now imagine an application which does ten times that many draws per frame. This is viewperf, which represents common use cases of CAD-adjacent technologies. Where other applications might hammer on the GPU, viewperf tests the CPU utilization. It’s what separates the real developers from average, sane people.
So all those months ago, I ran viewperf on zink, and I ended up here:
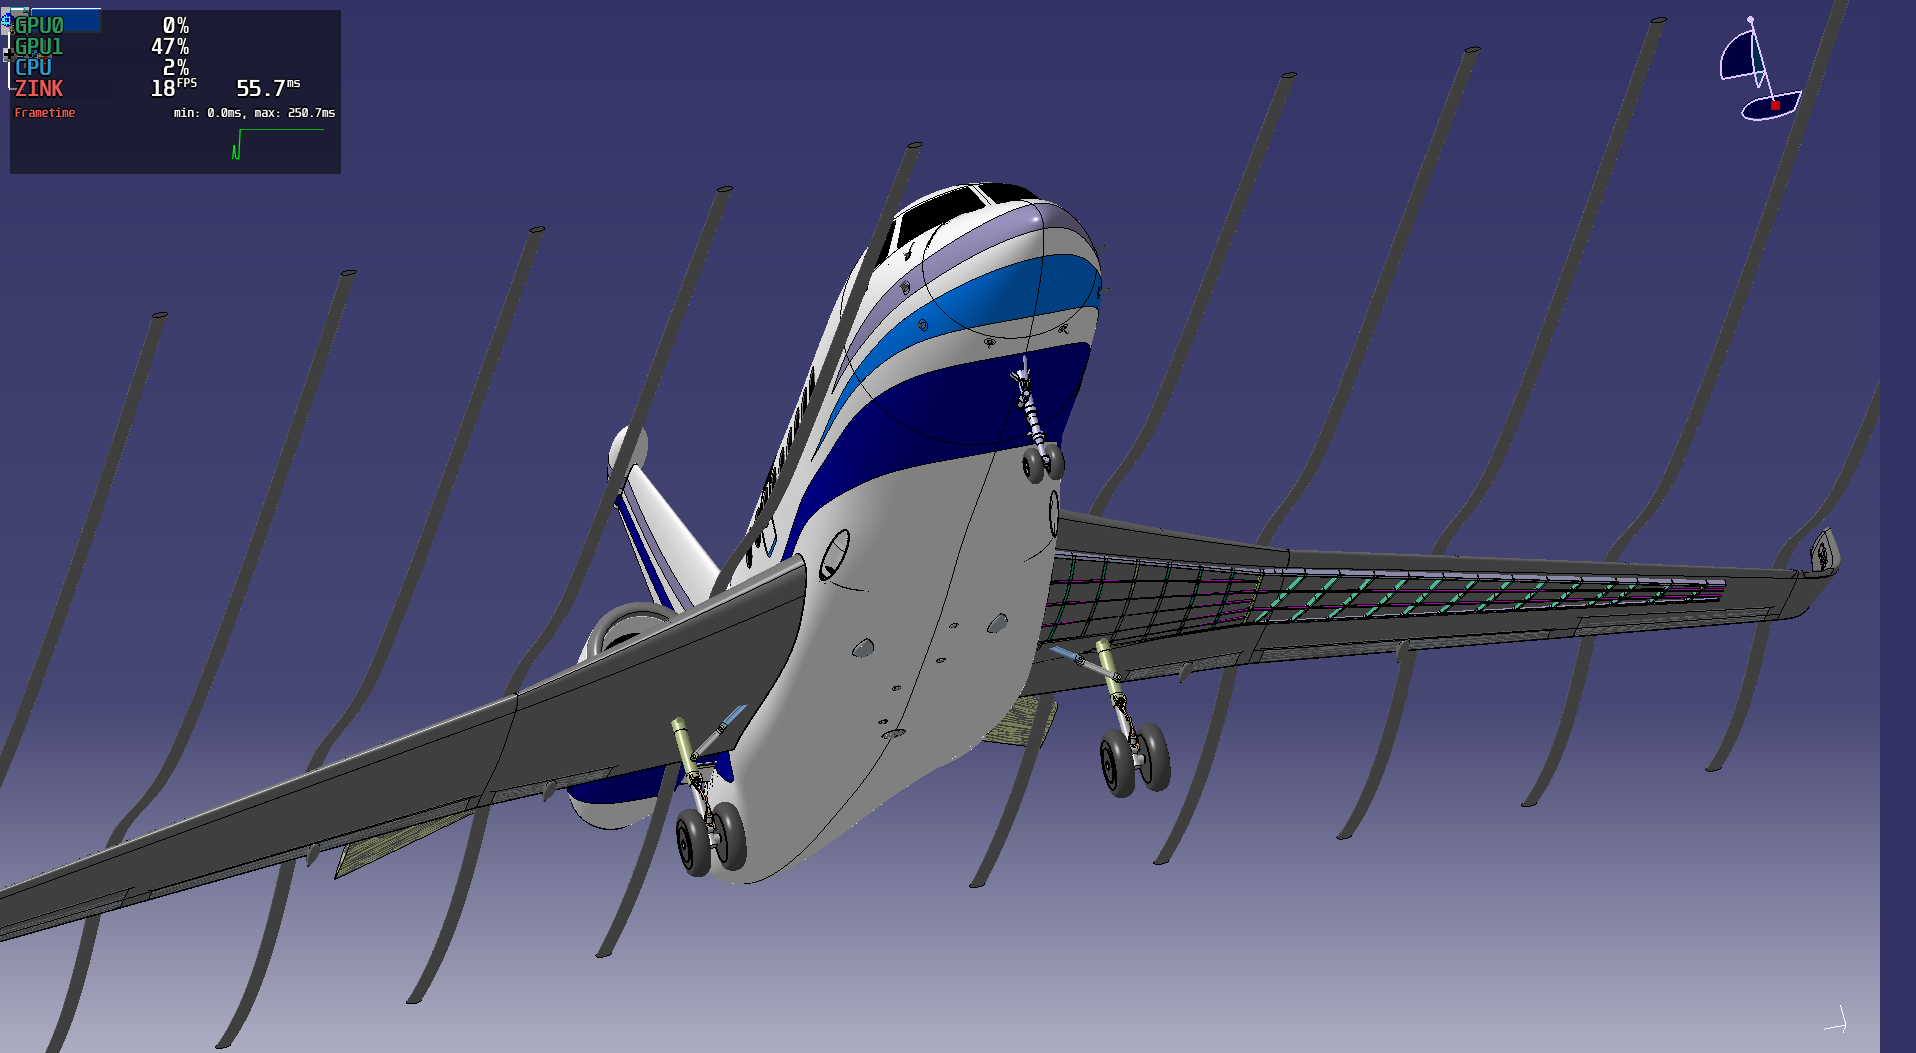
18fps. This is on threadripper 5975WX with RADV; not the most modern or powerful CPU, but it’s still pretty quick.
Then I loaded up radeonsi and got 100fps. Brutal.
Plumbing The Abyss
Examining this was where I entered into into realms of insanity not known to mere mortals. perf started to fail and give confusing results, other profilers just drew a circle around the driver and pointed to the whole thing as the problem area, and some tools just gave up entirely. No changes affected the performance in any way. This is when the savvy hacker begins profiling by elimination: delete as much code as possible and try to force changes.
Thus, I deleted a lot of code to see what would pop out, and eventually I discovered the horrifying truth: I was being bottlenecked by the sheer number of atomic operations occurring.
Like I said before, viewperf does upwards of 100,000 draw calls per frame. This means 100,000 draw calls, 100,000 vertex buffer binds (times two because there are two vertex buffers), 100,000 index buffer binds, and a few shader changes sprinkled in. The way that mesa/gallium work means that every single vertex buffer and index buffer which get sent to the driver incur multiple atomic operations (each) along the way for refcounting: because gallium uses refcounting rather than an ownership model since it is much easier to manage. That means we’re talking about upwards of 300,000 atomic operations per frame.
Unfortunately, hackily deleting all the refcounting made the FPS go brrrrr, and it was a long road to legitimately get there. A very, very long road. Six months, in fact. But all the unhinged MRs above landed, reducing the surface area of the refcounting to just buffers, which put me in a position to do this pro gamer move where I also am removing all the refcounting from the buffers.
This works, roughly speaking, by enforcing ownership on the buffers and then releasing them when they are no longer used. Sounds simple, but plumbing it through all the gallium drivers without breaking everything was less so. Let’s see where moving to that model gets the numbers:
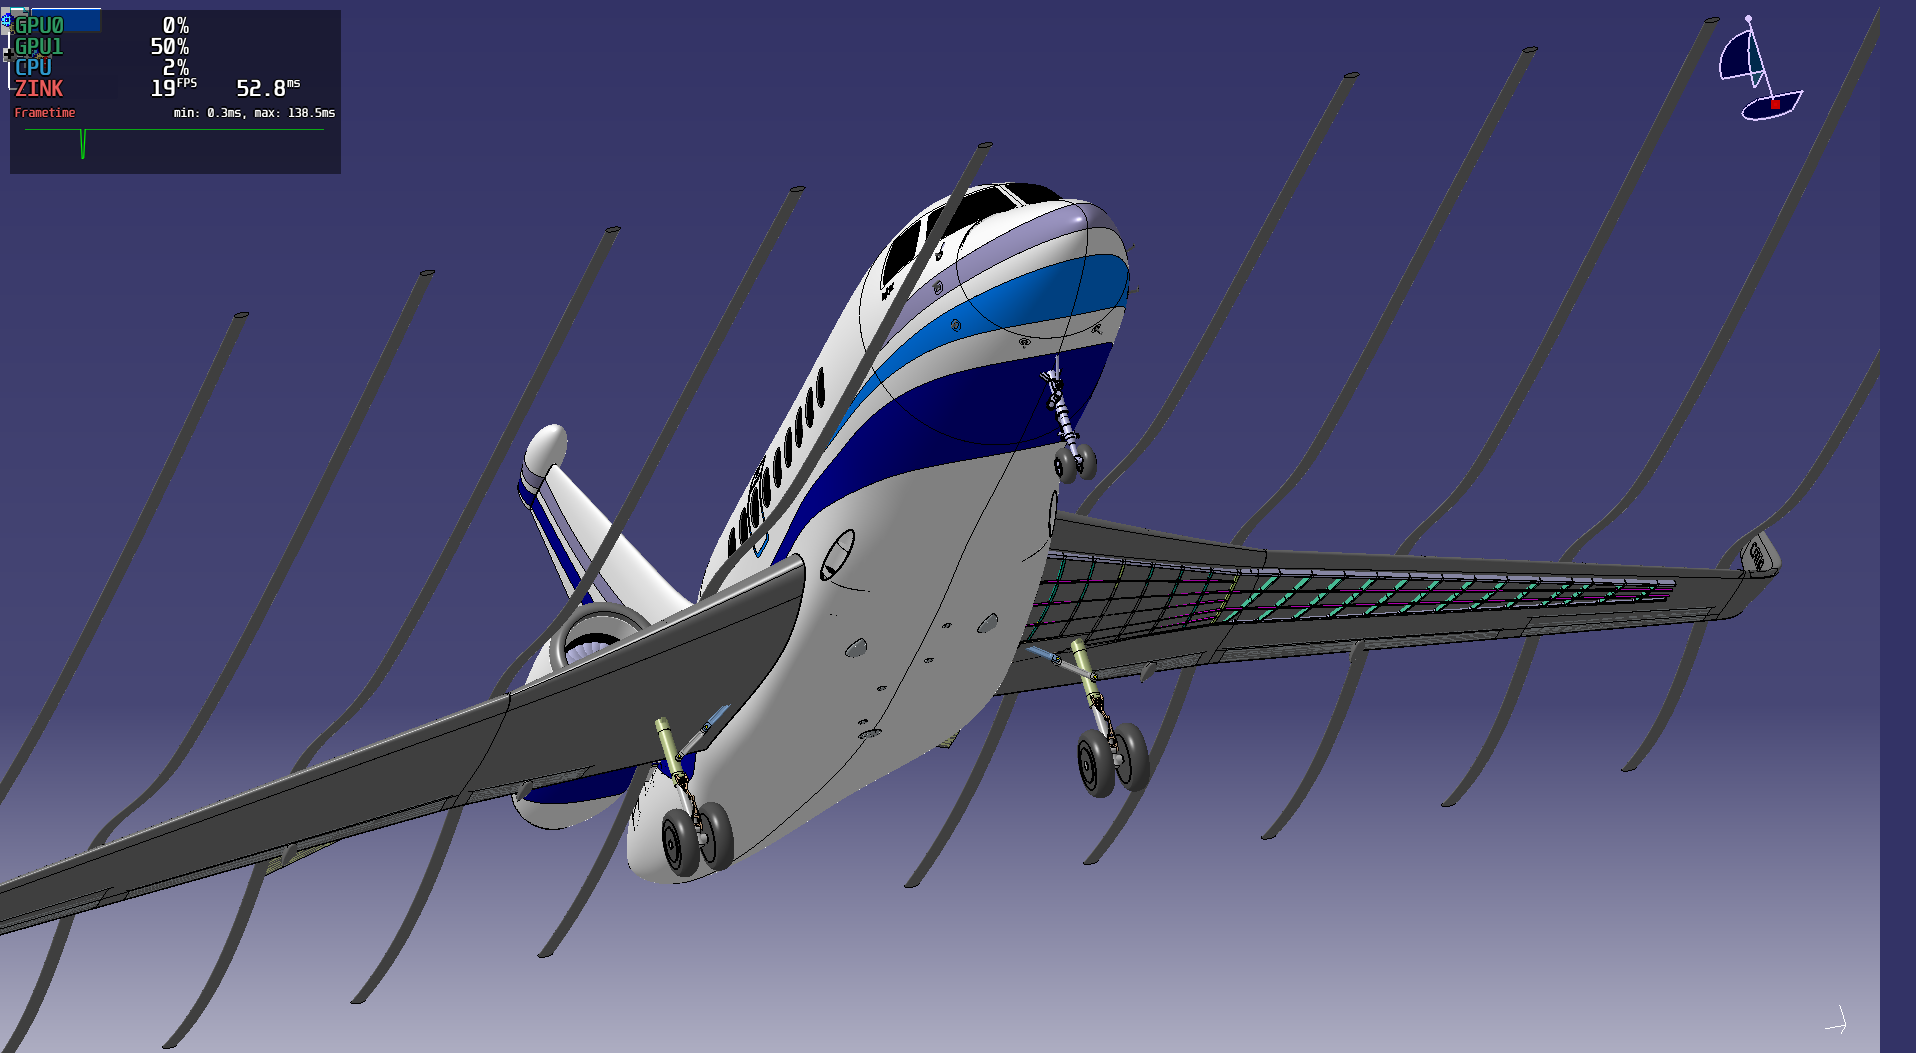
One more frame. Tremendous.
But wait, there’s more. The other part of that MR further deletes all the refcounting in zink for buffers, fully removing the atomics. And…
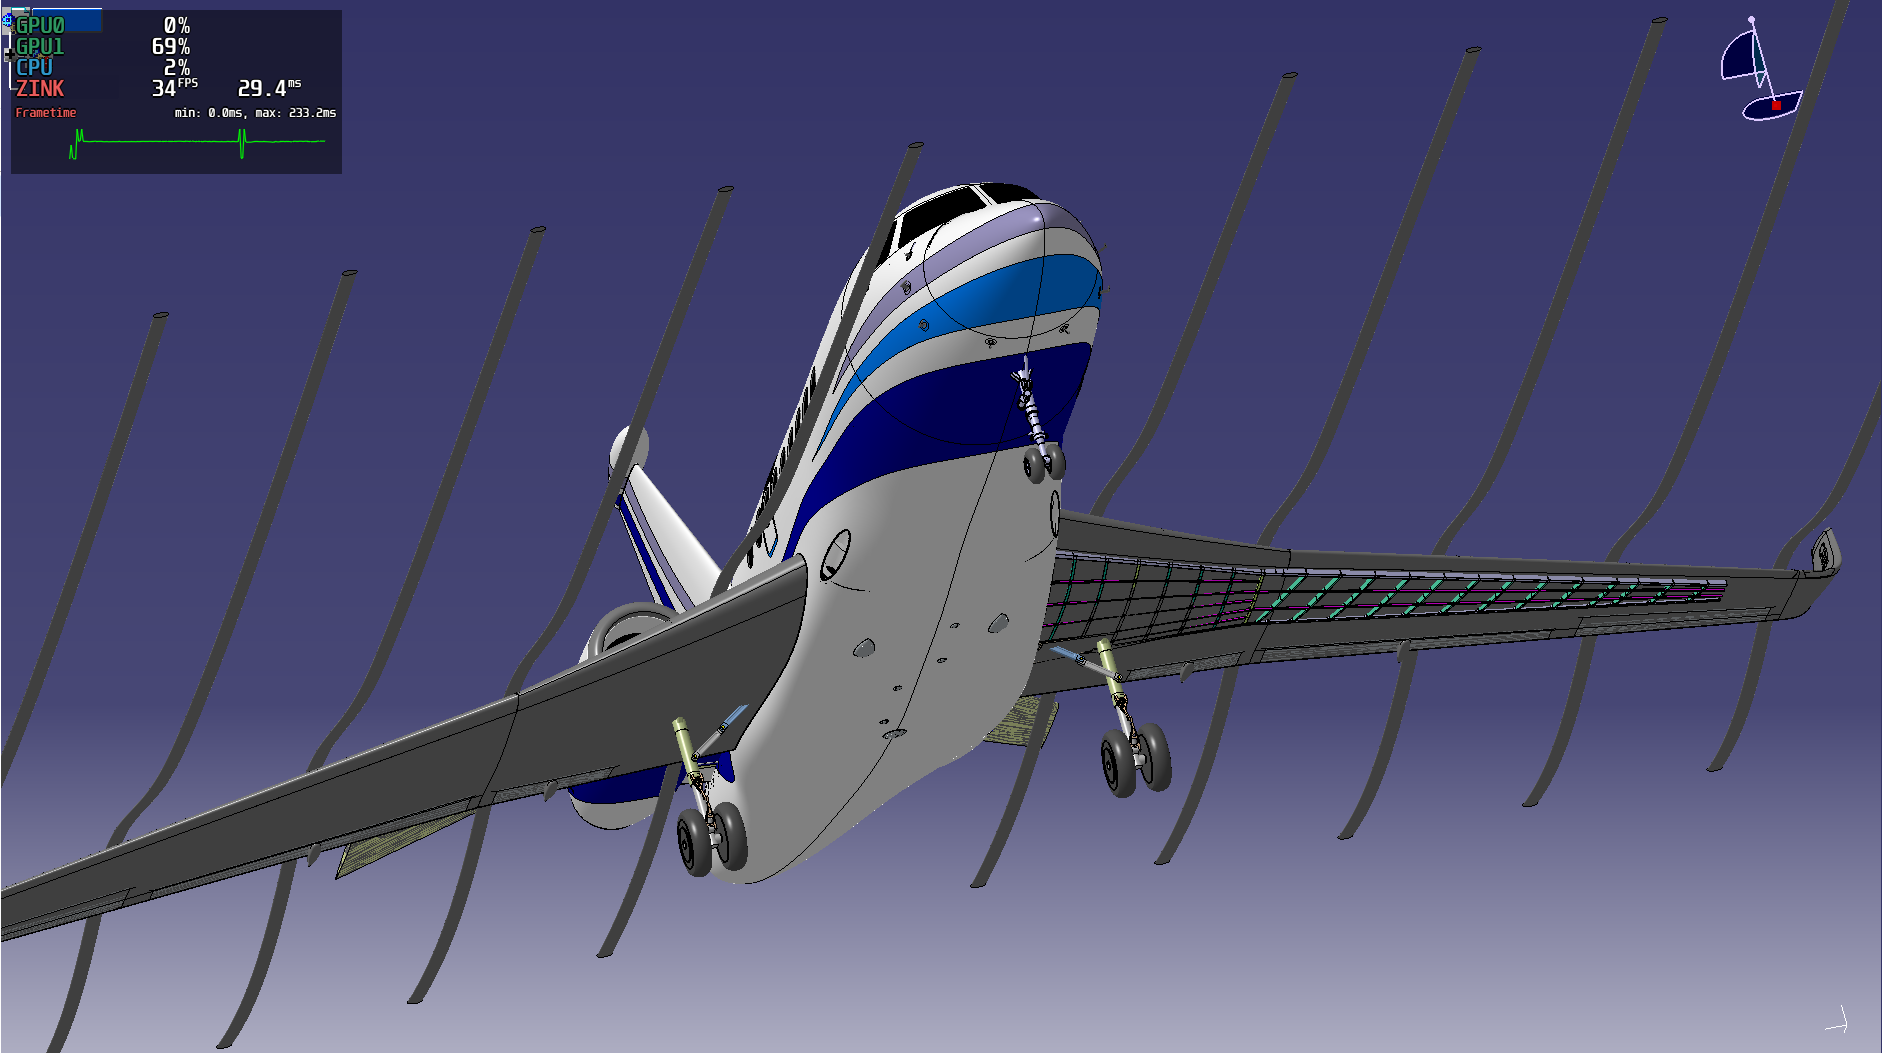
Blammo, that doubles the perf and manages to eliminate the bottleneck, which sets the stage for further improvements. The gap is still large, but it’s about to close real fast.
Shout out to Marek for heroically undertaking the review of this leviathan.