Performance Can Only Increase
Jumping Right In
When last I left off, I’d cleared out 2/3 of my checklist for improving update_sampler_descriptors() performance:
add_transition(), which is a function for accumulating and merging memory barriers for resources using a hash tablebind_descriptors(), which calls vkUpdateDescriptorSets and vkCmdBindDescriptorSets- handle_image_descriptor(), which is a helper for setting up sampler/image descriptors
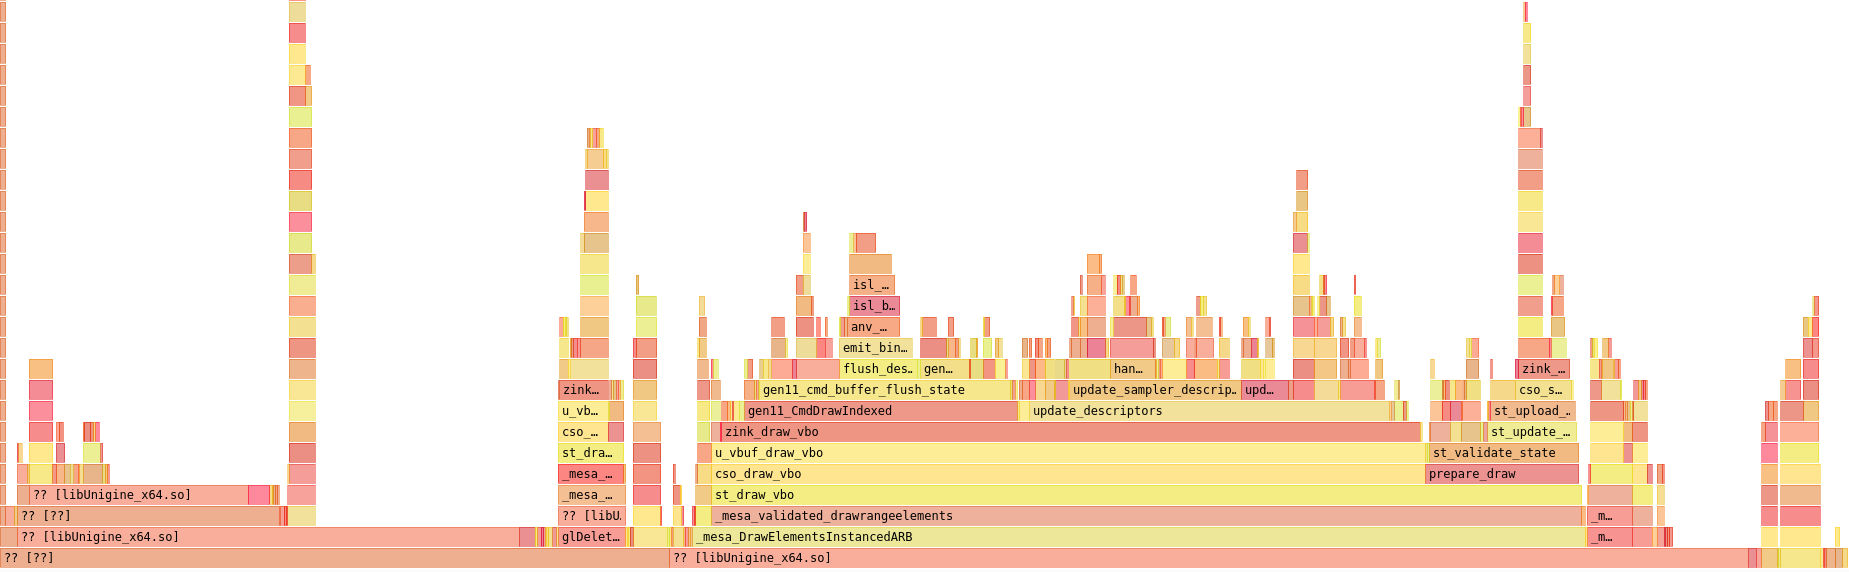
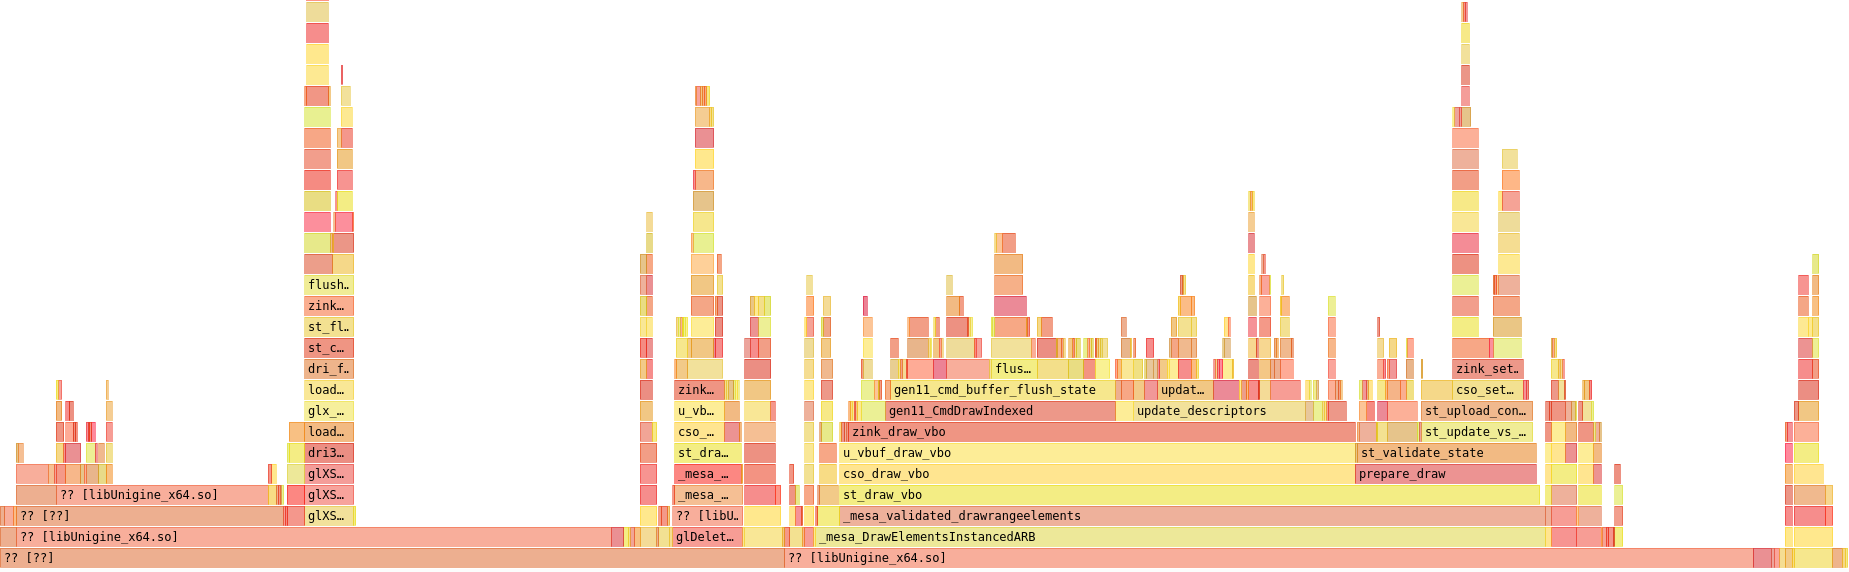
handle_image_descriptor() was next on my list. As a result, I immediately dove right into an entirely different part of the flamegraph since I’d just been struck by a seemingly-obvious idea. Here’s the last graph:
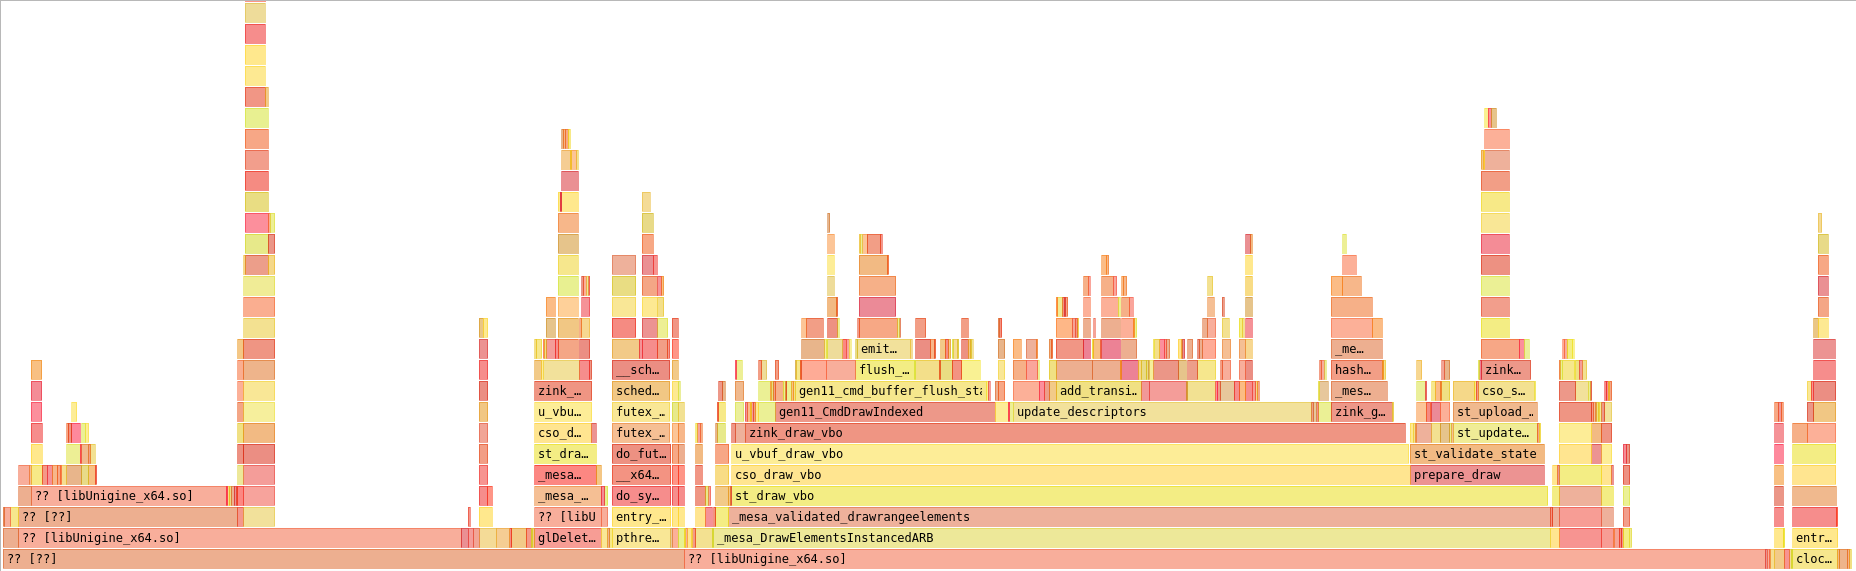
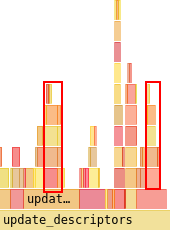
Here’s the next step:
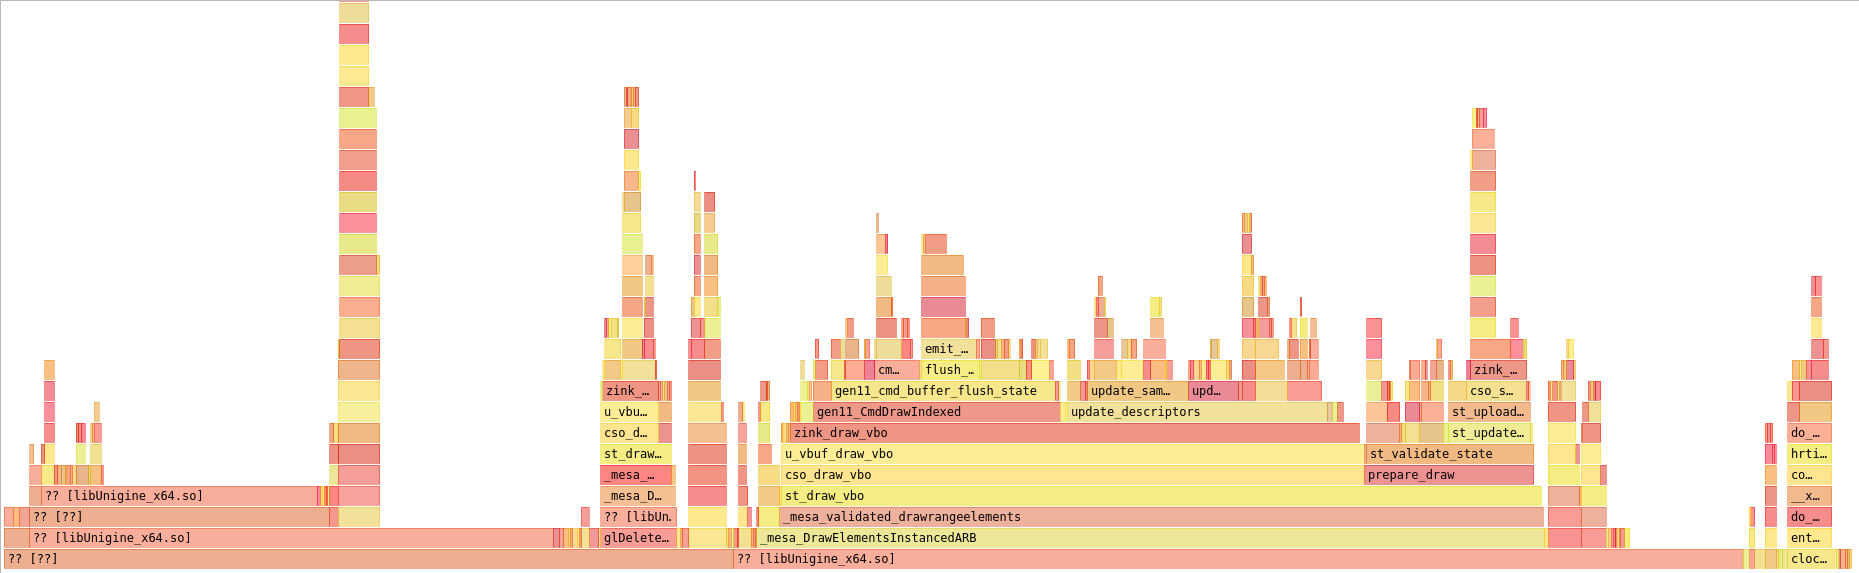
What changed?
Well, as I’m now caching descriptor sets across descriptor pools, it occurred to me that, assuming my descriptor state hashing mechanism is accurate, all the resources used in a given set must be identical. This means that all resources for a given type (e.g., UBO, SSBO, sampler, image) must be completely identical to previous uses across all shader stages. Extrapolating further, this also means that the way in which these resources are used must also identical, which means the pipeline barriers for access and image layouts must also be identical.
Which means they can be stored onto the struct zink_descriptor_set object and reused instead of being accumulated every time. This reuse completely eliminates add_transition() from using any CPU time (it’s the left-most block above update_sampler_descriptors() in the first graph), and it thus massively reduces overall time for descriptor updates.
This marks a notable landmark, as it’s the point at which update_descriptors() begins to use only ~50% of the total CPU time consumed in zink_draw_vbo(), with the other half going to the draw command where it should be.
handle_image_descriptor()
At last my optimization-minded workflow returned to this function, and looking at the flamegraph again yielded the culprit. It’s not visible due to this being a screenshot, but the whole of the perf hog here was obvious, so let’s check out the function itself since it’s small. I think I explored part of this at one point in the distant past, possibly for ARB_texture_buffer_object, but refactoring has changed things up a bit:
static void
handle_image_descriptor(struct zink_screen *screen, struct zink_resource *res, enum zink_descriptor_type type, VkDescriptorType vktype, VkWriteDescriptorSet *wd,
                        VkImageLayout layout, unsigned *num_image_info, VkDescriptorImageInfo *image_info, struct zink_sampler_state *sampler,
                        VkBufferView *null_view, VkImageView imageview, bool do_set)
First, yes, there’s a lot of parameters. There’s a lot of them, including VkBufferView *null_view, which is a pointer to a stack array that’s initialized as containing VK_NULL_HANDLE. As VkDescriptorImageInfo must be initialized with a pointer to an array for texel buffers, it’s important that the stack variable used doesn’t go out of scope, so it has to be passed in like this or else this functionality can’t be broken out in this way.
{
    if (!res) {
        /* if we're hitting this assert often, we can probably just throw a junk buffer in since
         * the results of this codepath are undefined in ARB_texture_buffer_object spec
         */
        assert(screen->info.rb2_feats.nullDescriptor);

        switch (vktype) {
        case VK_DESCRIPTOR_TYPE_UNIFORM_TEXEL_BUFFER:
        case VK_DESCRIPTOR_TYPE_STORAGE_TEXEL_BUFFER:
           wd->pTexelBufferView = null_view;
           break;
        case VK_DESCRIPTOR_TYPE_COMBINED_IMAGE_SAMPLER:
        case VK_DESCRIPTOR_TYPE_STORAGE_IMAGE:
           image_info->imageLayout = VK_IMAGE_LAYOUT_UNDEFINED;
           image_info->imageView = VK_NULL_HANDLE;
           if (sampler)
              image_info->sampler = sampler->sampler[0];
           if (do_set)
              wd->pImageInfo = image_info;
           ++(*num_image_info);
           break;
        default:
           unreachable("unknown descriptor type");
        }
This is just handling for null shader inputs, which is permitted by various GL specs.
     } else if (res->base.target != PIPE_BUFFER) {
        assert(layout != VK_IMAGE_LAYOUT_UNDEFINED);
        image_info->imageLayout = layout;
        image_info->imageView = imageview;
        if (sampler) {
           VkFormatProperties props;
           vkGetPhysicalDeviceFormatProperties(screen->pdev, res->format, &props);
This vkGetPhysicalDeviceFormatProperties call is actually the entire cause of handle_image_descriptor() using any CPU time, at least on ANV. The lookup for the format is a significant bottleneck here, so it has to be removed.
           if ((res->optimial_tiling && props.optimalTilingFeatures & VK_FORMAT_FEATURE_SAMPLED_IMAGE_FILTER_LINEAR_BIT) ||
               (!res->optimial_tiling && props.linearTilingFeatures & VK_FORMAT_FEATURE_SAMPLED_IMAGE_FILTER_LINEAR_BIT))
              image_info->sampler = sampler->sampler[0];
           else
              image_info->sampler = sampler->sampler[1] ?: sampler->sampler[0];
        }
        if (do_set)
           wd->pImageInfo = image_info;
        ++(*num_image_info);
     }
}
Just for completeness, the remainder of this function is checking whether the device’s format features support the requested type of filtering (if linear), and then zink will fall back to nearest in other cases. Following this, do_set is true only for the base member of an image/sampler array of resources, and so this is the one that gets added into the descriptor set.
But now I’m again returning to vkGetPhysicalDeviceFormatProperties. Since this is using CPU, it needs to get out of the hotpath here in descriptor updating, but it does still need to be called. As such, I’ve thrown more of this onto the zink_screen object:
static void
populate_format_props(struct zink_screen *screen)
{
   for (unsigned i = 0; i < PIPE_FORMAT_COUNT; i++) {
      VkFormat format = zink_get_format(screen, i);
      if (!format)
         continue;
      vkGetPhysicalDeviceFormatProperties(screen->pdev, format, &screen->format_props[i]);
   }
}
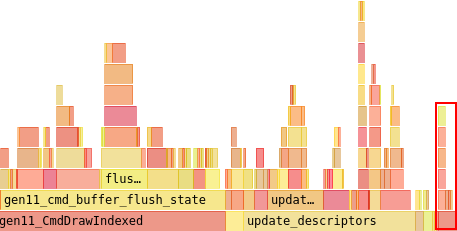
Indeed, now instead of performing the fetch on every decsriptor update, I’m just grabbing all the properties on driver init and then using the cached values throughout. Let’s see how this looks.
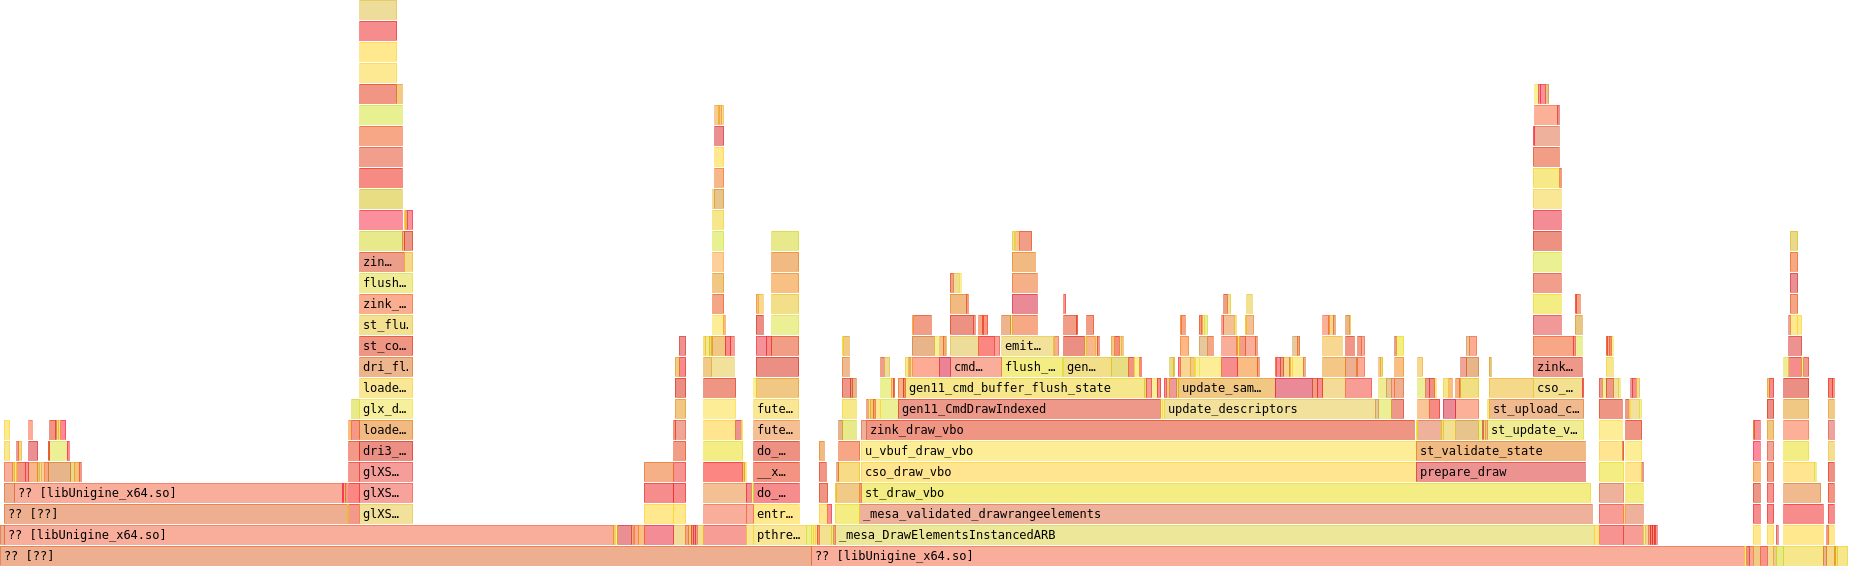
update_descriptors() is now using visibly less time than the draw command, though not by a huge amount. I’m also now up to an unstable 33fps.
Some Cleanups
At this point, it bears mentioning that I wasn’t entirely satisfied with the amount of CPU consumed by descriptor state hashing, so I ended up doing some pre-hashing here for samplers, as they have the largest state. At the beginning, the hashing looked like this:
In this case, each sampler descriptor hash was the size of a VkDescriptorImageInfo, which is 2x 64bit values and a 32bit value, or 20bytes of hashing per sampler. That ends up being a lot of hashing, and it also ends up being a lot of repeatedly hashing the same values.
Instead, I changed things around to do some pre-hashing:
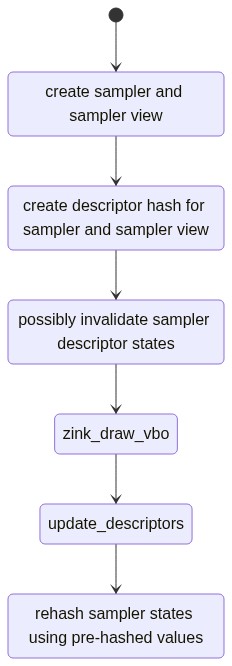
In this way, I could have a single 32bit value representing the sampler view that persisted for its lifetime, and a pair of 32bit values for the sampler (since I still need to potentially toggle between linear and nearest filtering) that I can select between. This ends up being 8bytes to hash, which is over 50% less. It’s not a huge change in the flamegraph, but it’s possibly an interesting factoid. Also, as the layouts will always be the same for these descriptors, that member can safely be omitted from the original sampler_view hash.
Set Usage
Another vaguely interesting tidbit is profiling zink’s usage of mesa’s set implementation, which is used to ensure that various objects are only added to a given batch a single time. Historically the pattern for use in zink has been something like:
if (!_mesa_set_search(set, value)) {
   do_something();
   _mesa_set_add(set, value);
}
This is not ideal, as it ends up performing two lookups in the set for cases where the value isn’t already present. A much better practice is:
bool found = false;
_mesa_set_search_and_add(set, value, &found);
if (!found)
    do_something();
In this way, the lookup is only done once, which ends up being huge for large sets.
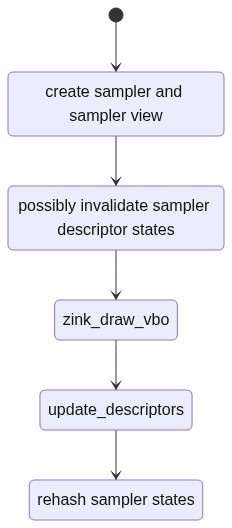
For My Final Trick
I was now holding steady at 33fps, but there was a tiny bit more performance to squeeze out of descriptor updating when I began to analyze how much looping was being done. This is a general overview of all the loops in update_descriptors() for each type of descriptor at the time of my review:
- loop for all shader stages
- loop for all bindings in the shader
- in sampler and image bindings, loop for all resources in the binding
- loop for all bindings in the shader
- loop for all resources in descriptor set
- loop for all barriers to be applied in descriptor set
This was a lot of looping, and it was especially egregious in the final component of my refactored update_descriptors():
static bool
write_descriptors(struct zink_context *ctx, struct zink_descriptor_set *zds, unsigned num_wds, VkWriteDescriptorSet *wds,
                 unsigned num_resources, struct zink_descriptor_resource *resources, struct set *persistent,
                 bool is_compute, bool cache_hit)
{
   bool need_flush = false;
   struct zink_batch *batch = is_compute ? &ctx->compute_batch : zink_curr_batch(ctx);
   struct zink_screen *screen = zink_screen(ctx->base.screen);
   assert(zds->desc_set);
   unsigned check_flush_id = is_compute ? 0 : ZINK_COMPUTE_BATCH_ID;
   for (int i = 0; i < num_resources; ++i) {
      assert(num_resources <= zds->pool->num_resources);

      struct zink_resource *res = resources[i].res;
      if (res) {
         need_flush |= zink_batch_reference_resource_rw(batch, res, resources[i].write) == check_flush_id;
         if (res->persistent_maps)
            _mesa_set_add(persistent, res);
      }
      /* if we got a cache hit, we have to verify that the cached set is still valid;
       * we store the vk resource to the set here to avoid a more complex and costly mechanism of maintaining a
       * hash table on every resource with the associated descriptor sets that then needs to be iterated through
       * whenever a resource is destroyed
       */
      assert(!cache_hit || zds->resources[i] == res);
      if (!cache_hit)
         zink_resource_desc_set_add(res, zds, i);
   }
   if (!cache_hit && num_wds)
      vkUpdateDescriptorSets(screen->dev, num_wds, wds, 0, NULL);
   for (int i = 0; zds->pool->num_descriptors && i < util_dynarray_num_elements(&zds->barriers, struct zink_descriptor_barrier); ++i) {
      struct zink_descriptor_barrier *barrier = util_dynarray_element(&zds->barriers, struct zink_descriptor_barrier, i);
      zink_resource_barrier(ctx, NULL, barrier->res,
                            barrier->layout, barrier->access, barrier->stage);
   }

   return need_flush;
}
This function iterates over all the resources in a descriptor set, tagging them for batch usage and persistent mapping, adding references for the descriptor set to the resource as I previously delved into. Then it iterates over the barriers and applies them.
But why was I iterating over all the resources and then over all the barriers when every resource will always have a barrier for the descriptor set, even if it ends up getting filtered out based on previous usage?
It just doesn’t make sense.
So I refactored this a bit, and now there’s only one loop:
static bool
write_descriptors(struct zink_context *ctx, struct zink_descriptor_set *zds, unsigned num_wds, VkWriteDescriptorSet *wds,
                 struct set *persistent, bool is_compute, bool cache_hit)
{
   bool need_flush = false;
   struct zink_batch *batch = is_compute ? &ctx->compute_batch : zink_curr_batch(ctx);
   struct zink_screen *screen = zink_screen(ctx->base.screen);
   assert(zds->desc_set);
   unsigned check_flush_id = is_compute ? 0 : ZINK_COMPUTE_BATCH_ID;

   if (!cache_hit && num_wds)
      vkUpdateDescriptorSets(screen->dev, num_wds, wds, 0, NULL);
   for (int i = 0; zds->pool->num_descriptors && i < util_dynarray_num_elements(&zds->barriers, struct zink_descriptor_barrier); ++i) {
      struct zink_descriptor_barrier *barrier = util_dynarray_element(&zds->barriers, struct zink_descriptor_barrier, i);
      if (barrier->res->persistent_maps)
         _mesa_set_add(persistent, barrier->res);
      need_flush |= zink_batch_reference_resource_rw(batch, barrier->res, zink_resource_access_is_write(barrier->access)) == check_flush_id;
      zink_resource_barrier(ctx, NULL, barrier->res,
                            barrier->layout, barrier->access, barrier->stage);
   }

   return need_flush;
}
This actually has the side benefit of reducing the required looping even further, as barriers get merged based on access and stages, meaning that though there may be N resources used by a given set used by M stages, it’s possible that the looping here might be reduced to only N rather than N * M since all barriers might be consolidated.
In Closing
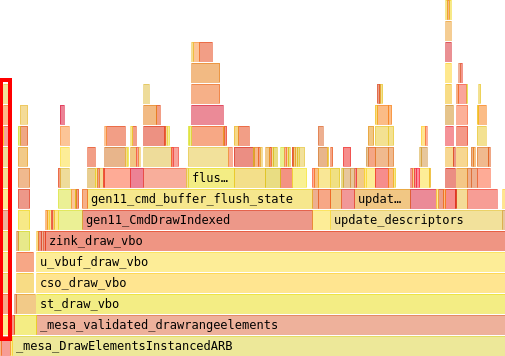
Let’s check all the changes out in the flamegraph:
This last bit has shaved off another big chunk of CPU usage overall, bringing update_descriptors() from 11.4% to 9.32%. Descriptor state updating is down from 0.718% to 0.601% from the pre-hashing as well, though this wasn’t exactly a huge target to hit.
Just for nostalgia, here’s the starting point from just after I’d split the descriptor types into different sets and we all thought 27fps with descriptor set caching was a lot:
But now zink is up another 25% performance to a steady 34fps:
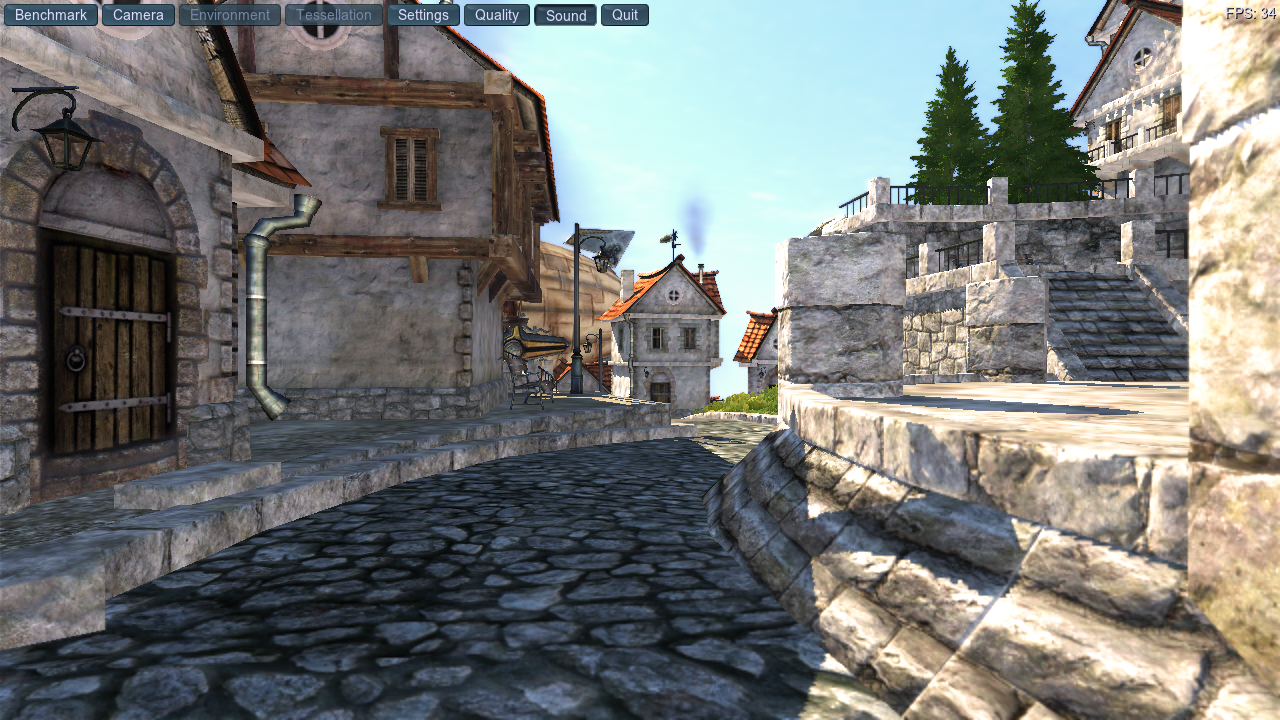
And I did it in only four blog posts.
For anyone interested, I’ve also put up a branch corresponding to the final flamegraph along with the perf data, which I’ve been using hotspot to view.
But Then, The Future
Looking forward, there’s still some easy work that can be done here.
For starters, I’d probably improve descriptor states a little such that I also had a flag anytime the batch cycled. This would enable me to add batch-tracking for resources/samplers/sampler_views more reliably when was actually necessary vs trying to add it every time, which ends up being a significant perf hit from all the lookups. I imagine that’d make a huge part of the remaining update_descriptors() usage disappear.
There’s also, as ever, the pipeline hashing, which can further be reduced by adding more dynamic state handling, which would remove more values from the pipeline state and thus reduce the amount of hashing required.
I’d probably investigate doing some resource caching to keep a bucket of destroyed resources around for faster reuse since there’s a fair amount of that going on.
Ultimately though, the CPU time in use by zink is unlikely to see any other huge decreases (unless I’m missing something especially obvious or clever) without more major architectural changes, which will end up being a bigger project that takes more than just a week of blog posting to finish. As such, I’ve once again turned my sights to unit test pass rates and related issues, since there’s still a lot of work to be done there.
I’ve fixed another 500ish piglit tests over the past few days, bringing zink up past 92% pass rate, and I’m hopeful I can get that number up even higher in the near future.
Stay tuned for more updates on all things zink and Mike.