The Doctor Is In
Addressing Concerns
After my last post, I received a very real, nonzero number of DMs bearing implications.
That’s right.
Messages like, “Nice blog post. I’m sure you totally know how to use RenderDoc.” and “Nice RenderDoc tutorial.” as well as “You don’t know how to use RenderDoc, do you?”
I even got a message from Baldur “Dr. Render” Karlsson asking to see my RenderDoc operator’s license. Which I definitely have. And it’s not expired.
I just, uh, don’t have it on me right now, officer.
But we can work something out, right?
Right?
Community Service
So I’m writing this post of my own free will, and in it we’re going to take a look at a real bug. Using RenderDoc.
Like a tutorial, but less useful.
If you want a real tutorial, you should be contacting Danylo Piliaiev, Professor Emeritus at Render University, for his self-help guide. Or watch his free zen meditation tutorial. Powerful stuff.
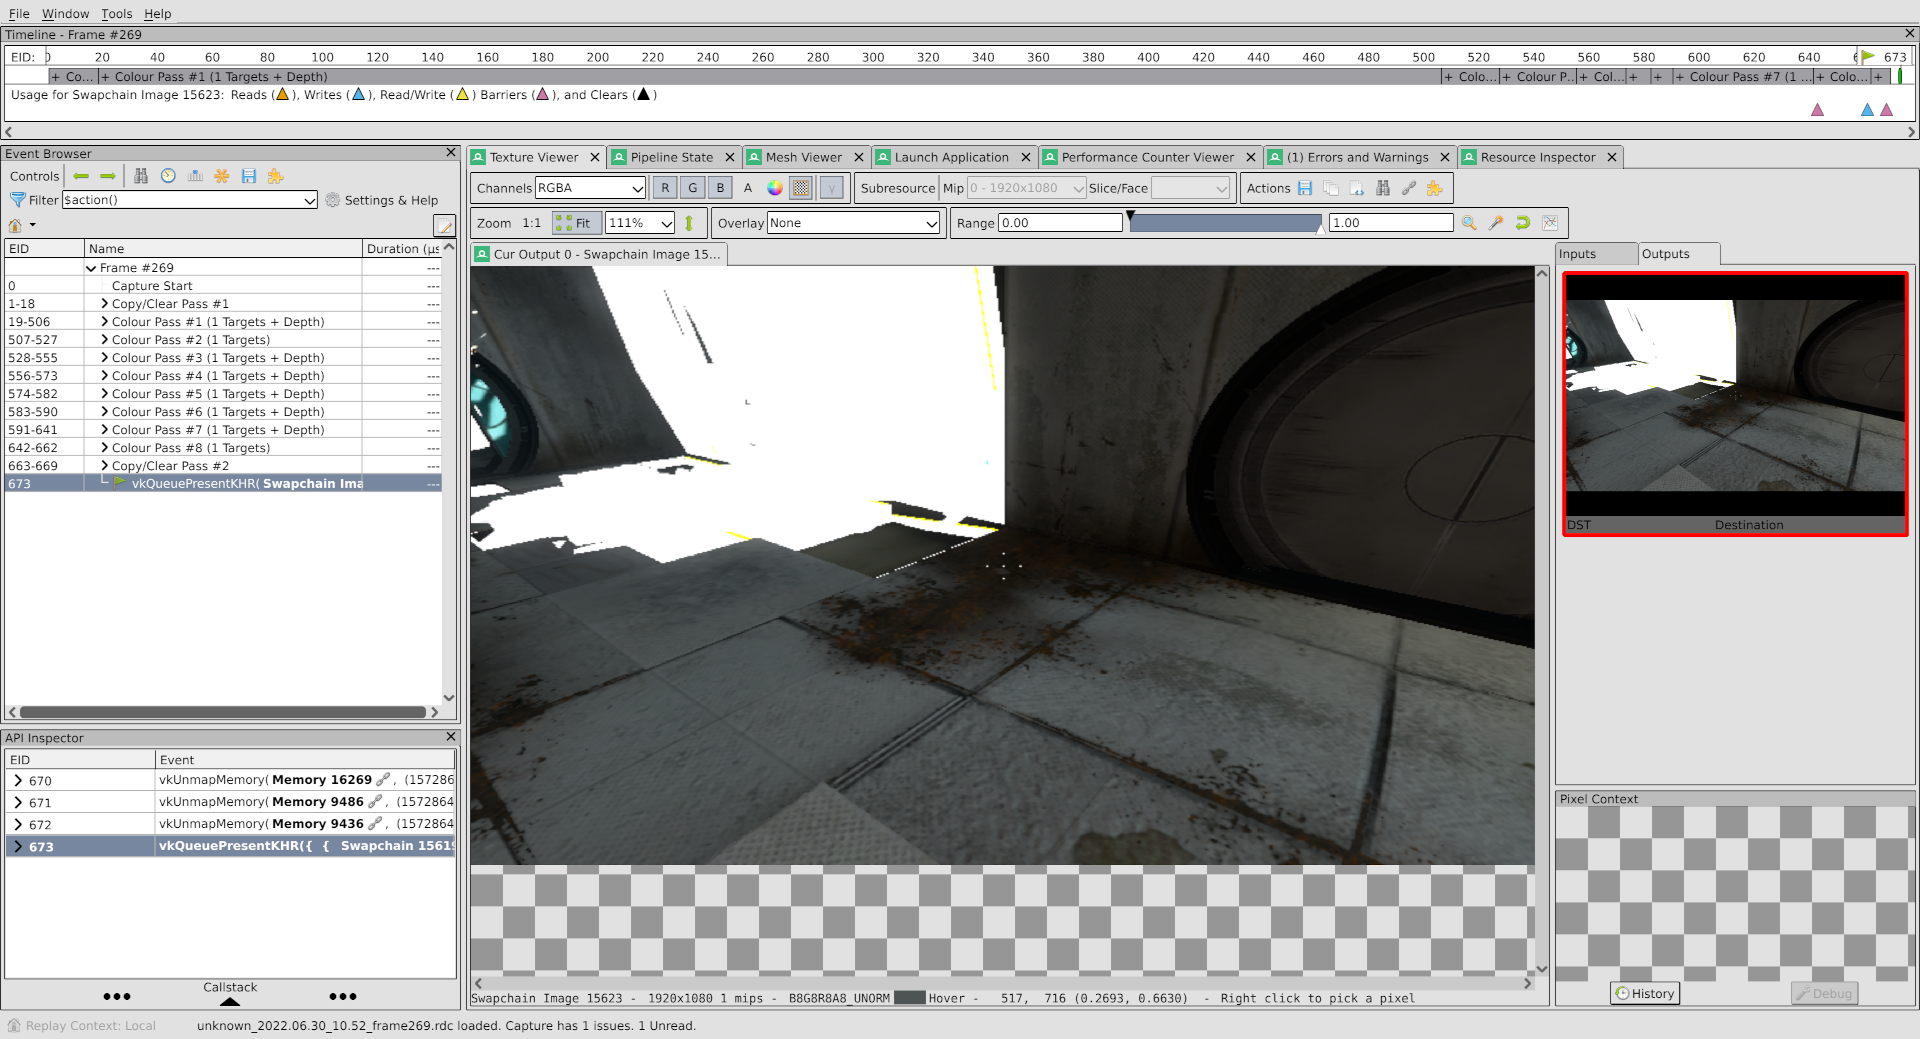
First, let’s open up the renderdoc capture for this bug:
What’s that? I skipped the part where I was supposed to describe how to get a capture?
Fine, fine, let’s go back.
RenderDoc + Zink: Not A HOWTO
If you’re not already a maestro of the most powerful graphics debugging tool on the planet, the process for capturing a frame on zink goes something like this:
LD_PRELOAD=/usr/lib64/librenderdoc.so MESA_LOADER_DRIVER_OVERRIDE=zink <executable>
I’ve been advised by my lawyer to state for the record that preloading the library in this manner is Not Officially Supported, and the GUI should be used whenever possible. But this isn’t a tutorial, so you can read the RenderDoc documentation to set up the GUI capture.
Moving along, if the case in question is a single frame apitrace, as is the case for this bug, there’s some additional legwork required:
LD_PRELOAD=/usr/lib64/librenderdoc.so MESA_LOADER_DRIVER_OVERRIDE=zink glretrace --loop portal2.trace
In particular here, the --loop parameter will replay the frame infinitely, enabling capture. There’s also the need to use F11 to cycle through until the Vulkan window is selected. And also possibly to disable GL support in RenderDoc so it doesn’t get confused.
But this isn’t a tutorial, so I’m gonna assume that once the trace starts playing at this point, it’s easy enough for anyone following along to press F11 a couple times to select Vulkan and then press F12 to capture the frame.
The Interface
This is more or less what RenderDoc will look like once the trace is opened:
Assuming, of course, that you are in one of these scenarios:
- not running on ANV
- running on ANV with this MR applied so the app doesn’t crash
- not running on Lavapipe since, obviously, this bug doesn’t exist there (R E F E R E N C E)
Running on Lavapipe, the interface looks more like this since Lavapipe has no bugs and all bugs disappear when running it:
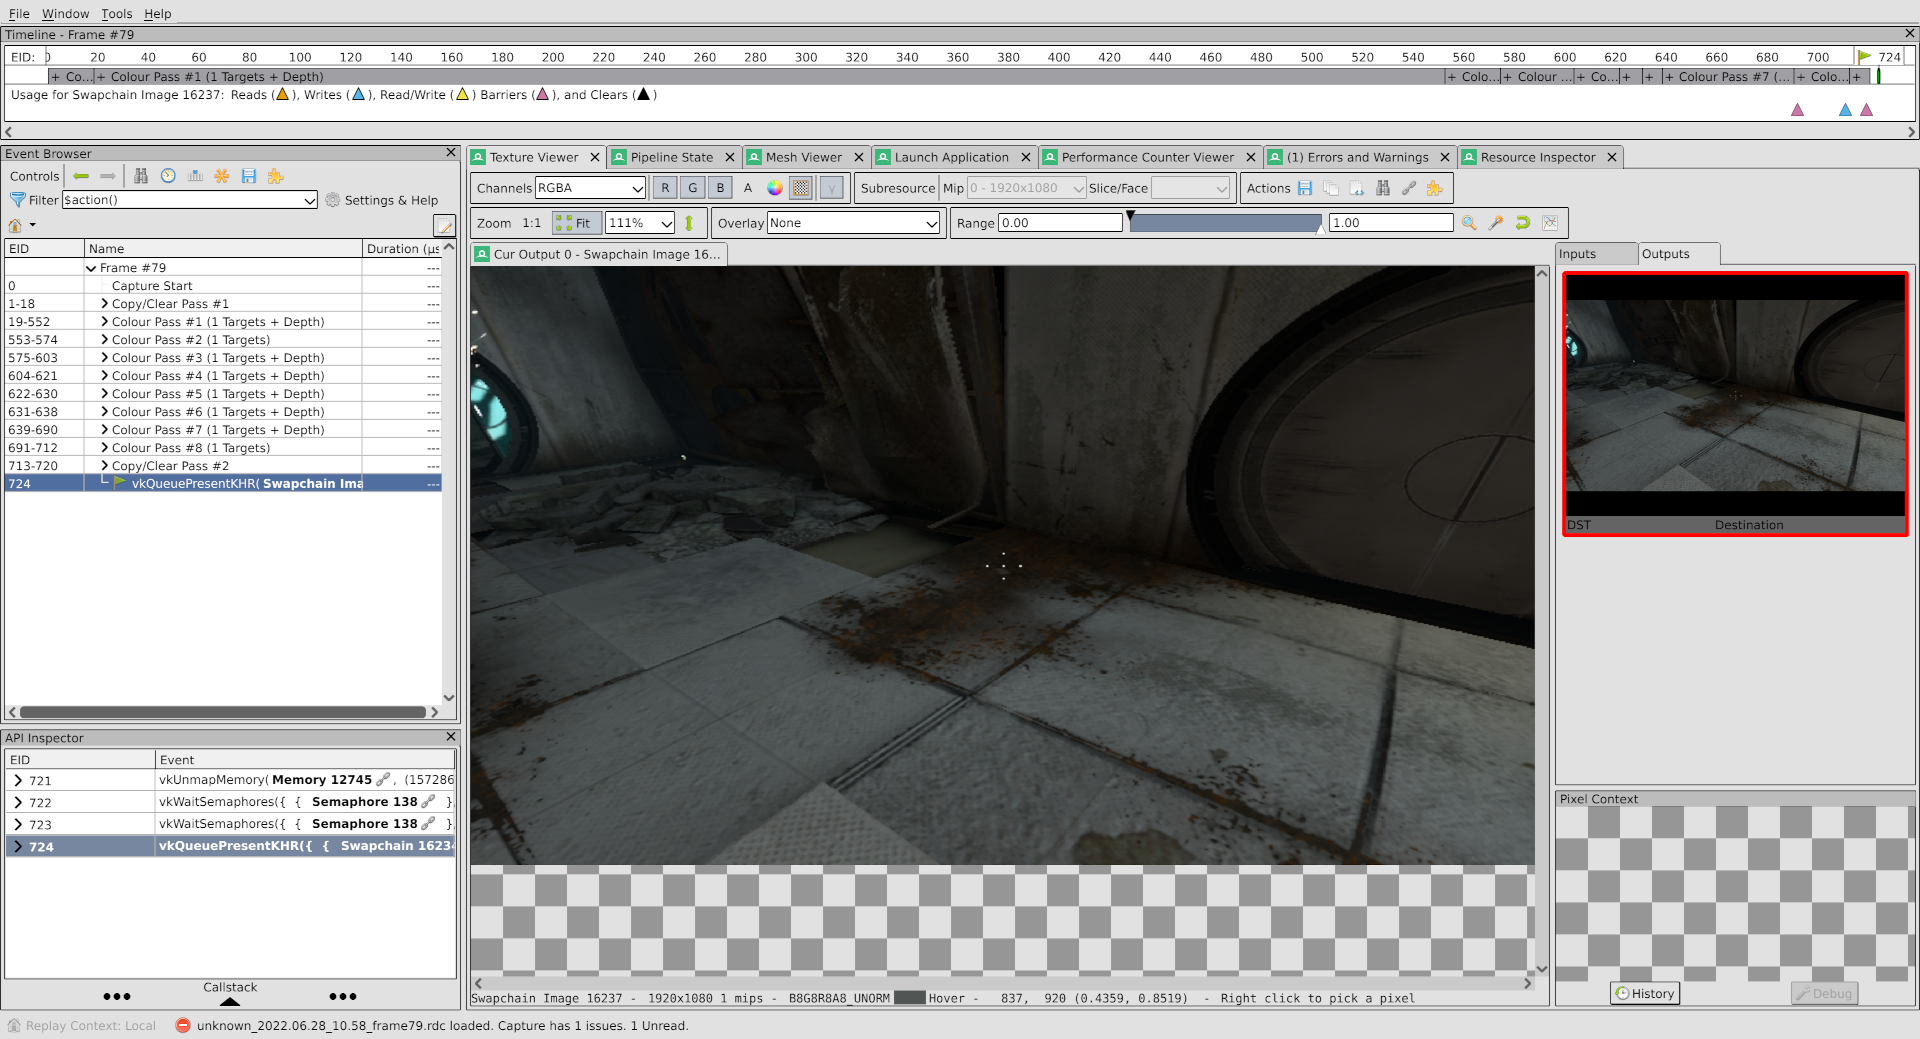
Incredible.
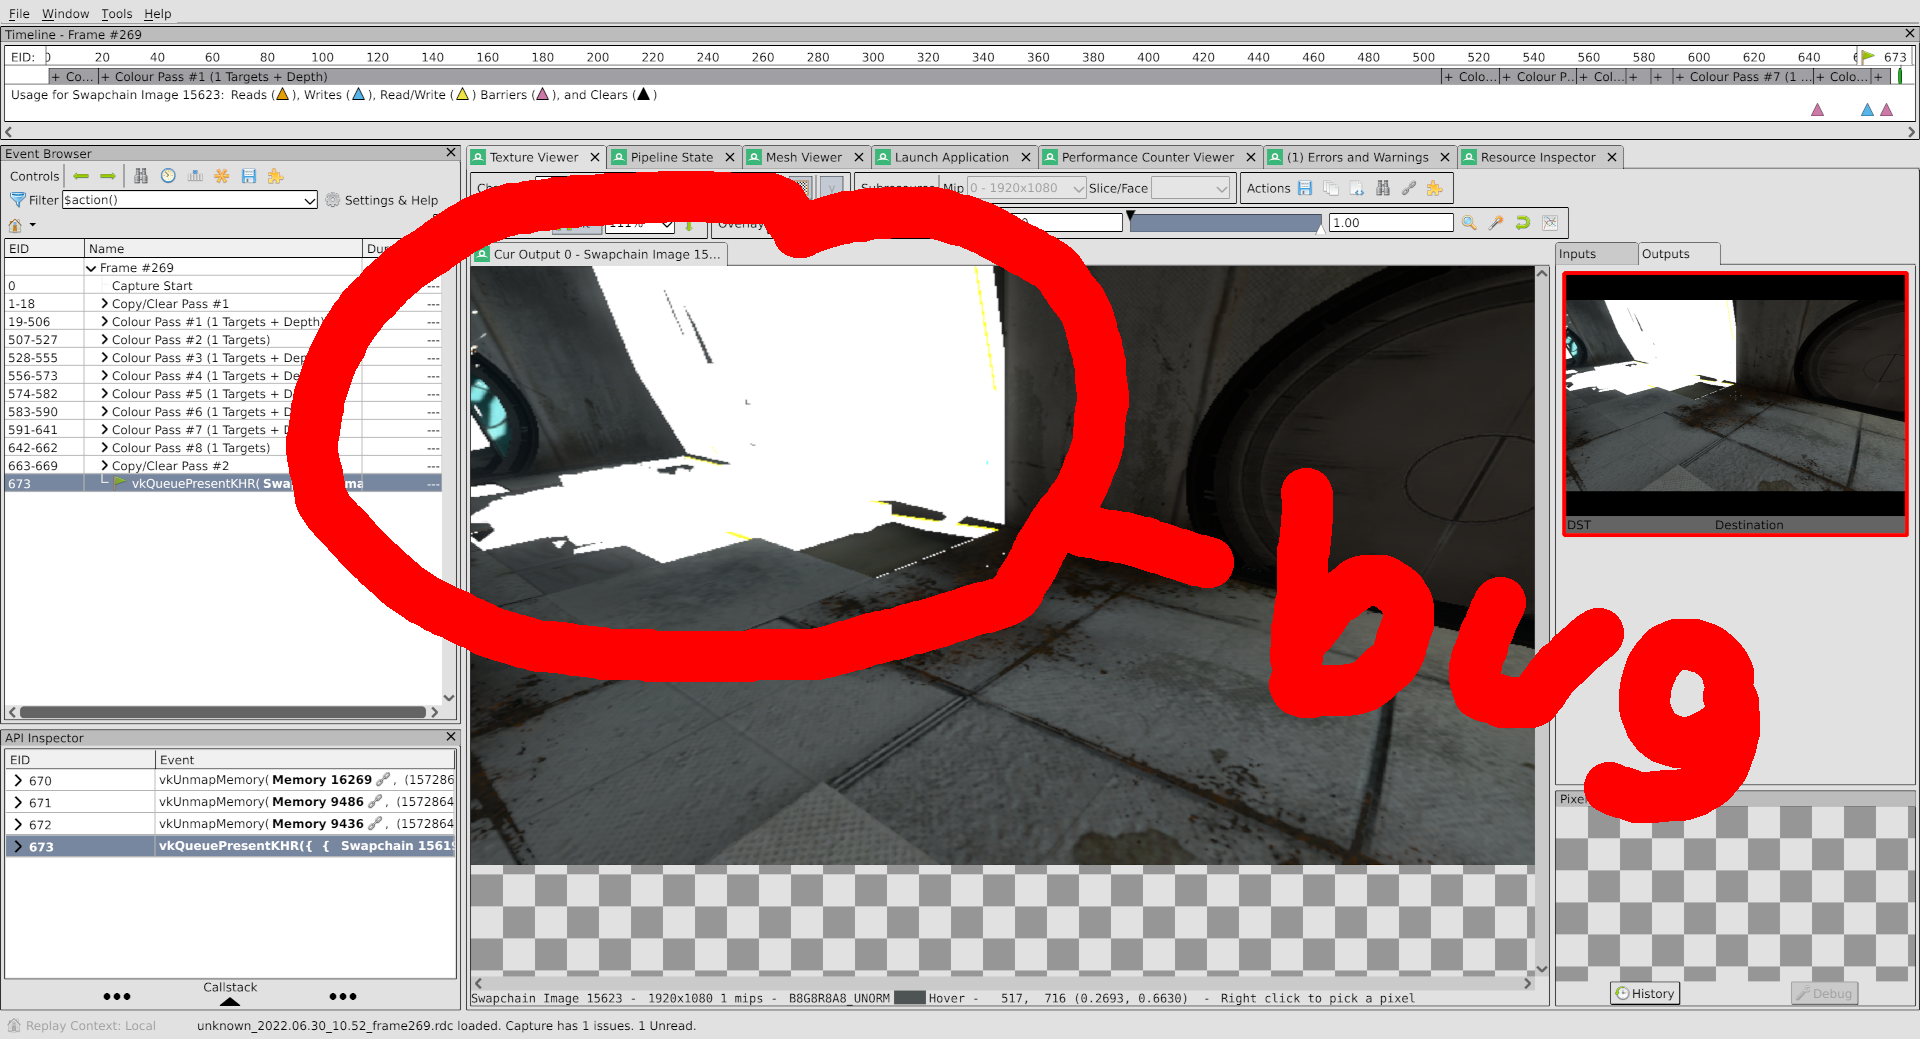
If you’re new to the blog, I’ve included a handy infographic to help you see the problem area in the ANV capture:
That’s all well and good, you might be saying, but how are you going to solve this problem?
Diving In
The first step when employing this tool is to locate a draw call which exhibits the problem that you’re attempting to solve. This can be done in the left pane by scrolling through the event list until the texture viewer displays a misrender.
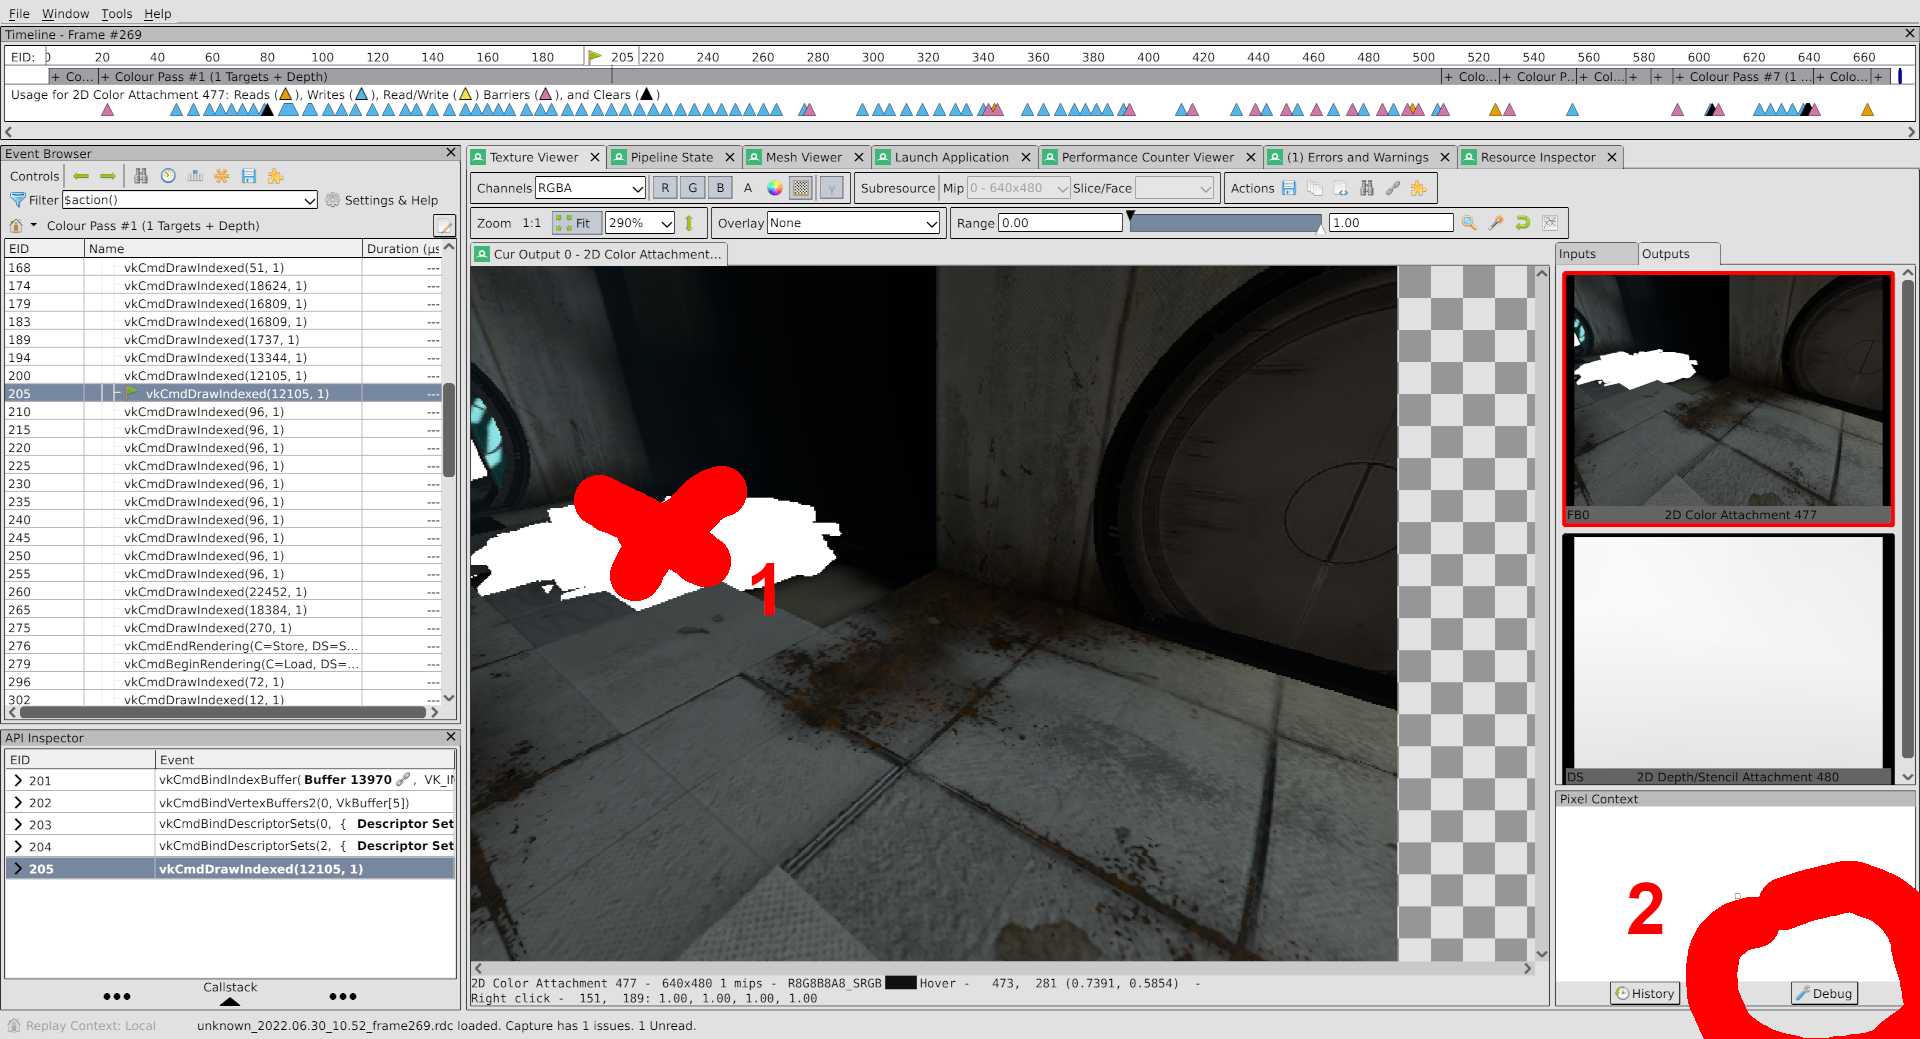
I’ve expedited the process by locating a problem draw:
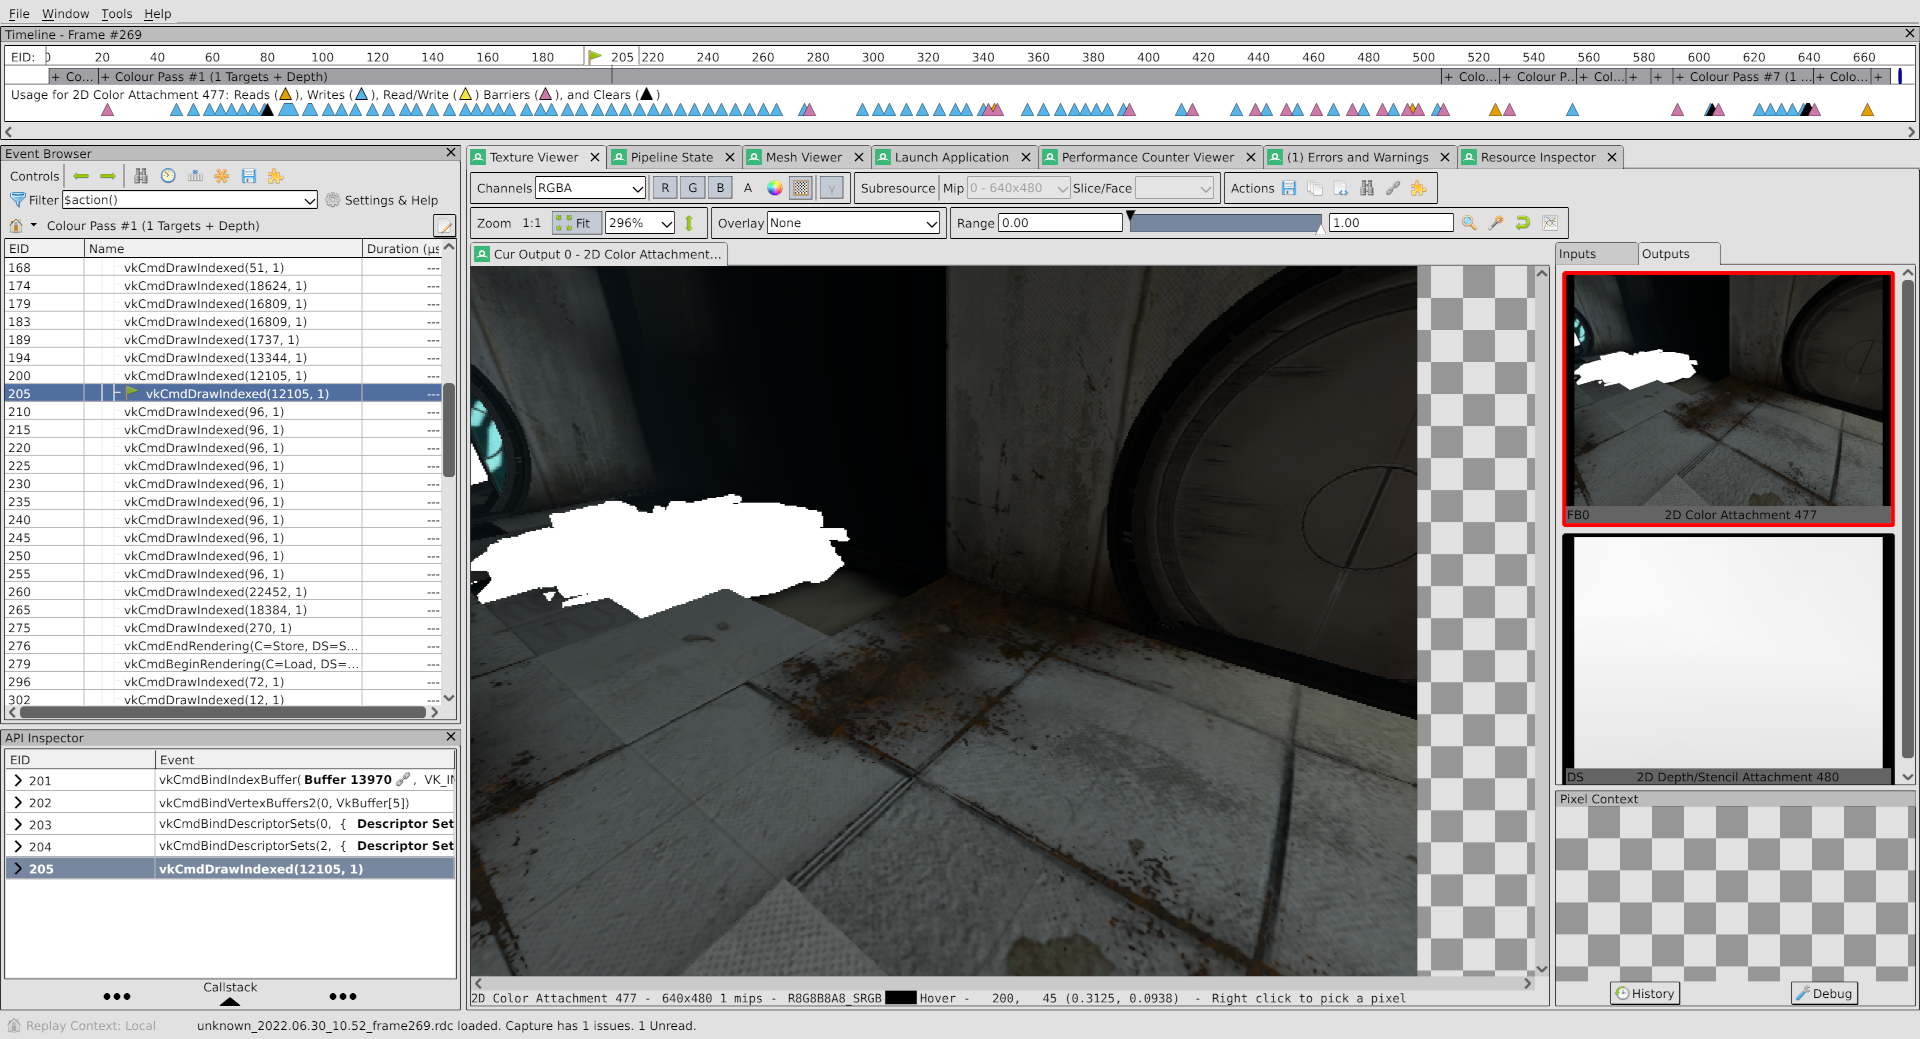
This pile of rubble is obviously missing the correct color, so the hunt begins.
With the draw call selected, I’m going to first check the vertex output data in the mesh viewer. If the draw isn’t producing the right geometry, that’s a problem.
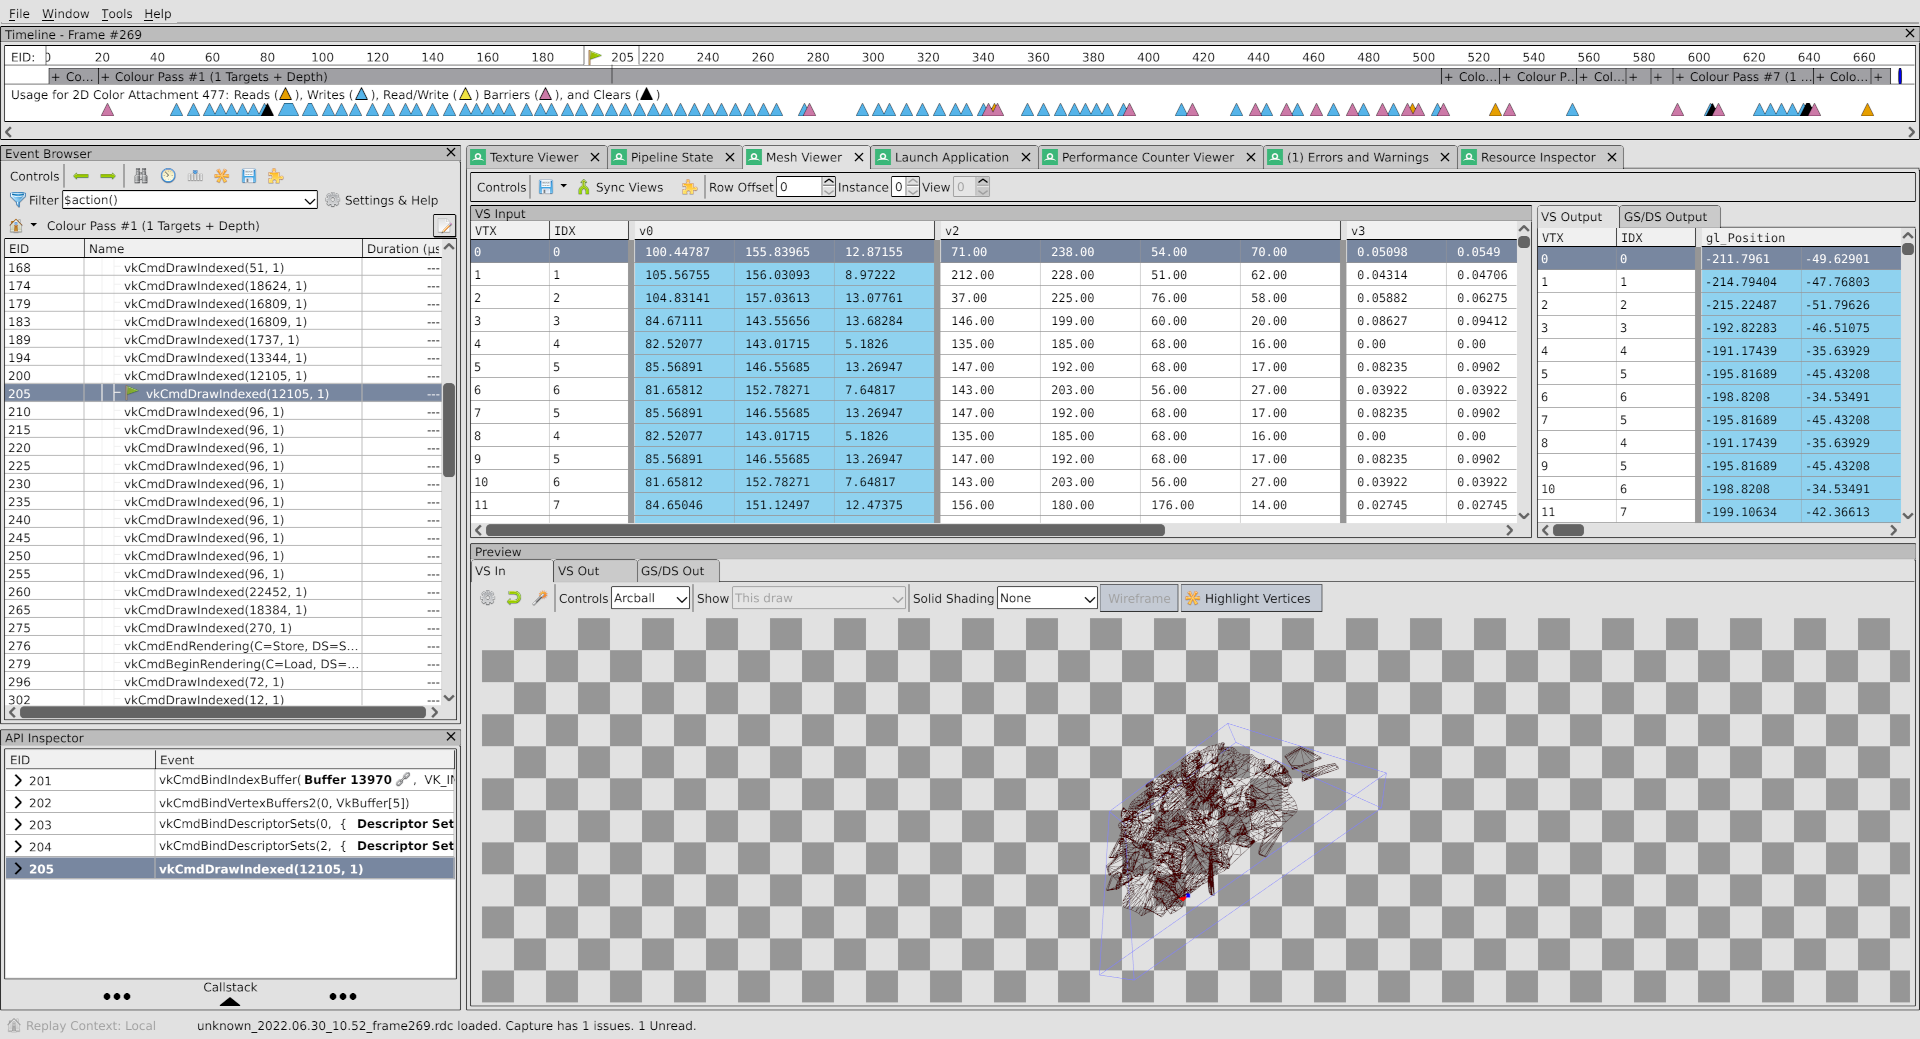
I’ve dragged the wireframe around a bit to try and get a good angle on it, but all I can really say is that it looks like a great pile of rubble. Looks good. A+ to whoever created it. Probably have some really smart people on payroll at a company like that.
The geometry is fine, so the color output must be broken. Let’s check that out.
First, go back to the texture viewer and right click somewhere on that rubble heap. Second, click the Debug button at the bottom right.
You’re now in the shader debugger. What an amazing piece of software this is that you can just debug shaders.
I’m going to do what’s called a “Pro Gamer Move” here since I’ve taken Danylo Piliaiev’s executive seminar in which he describes optimal RenderDoc usage as doing “what my intuition tells me”. Upon entering the debugger, I can see the shader variables being accessed, and I can immediately begin to speculate on a problem:
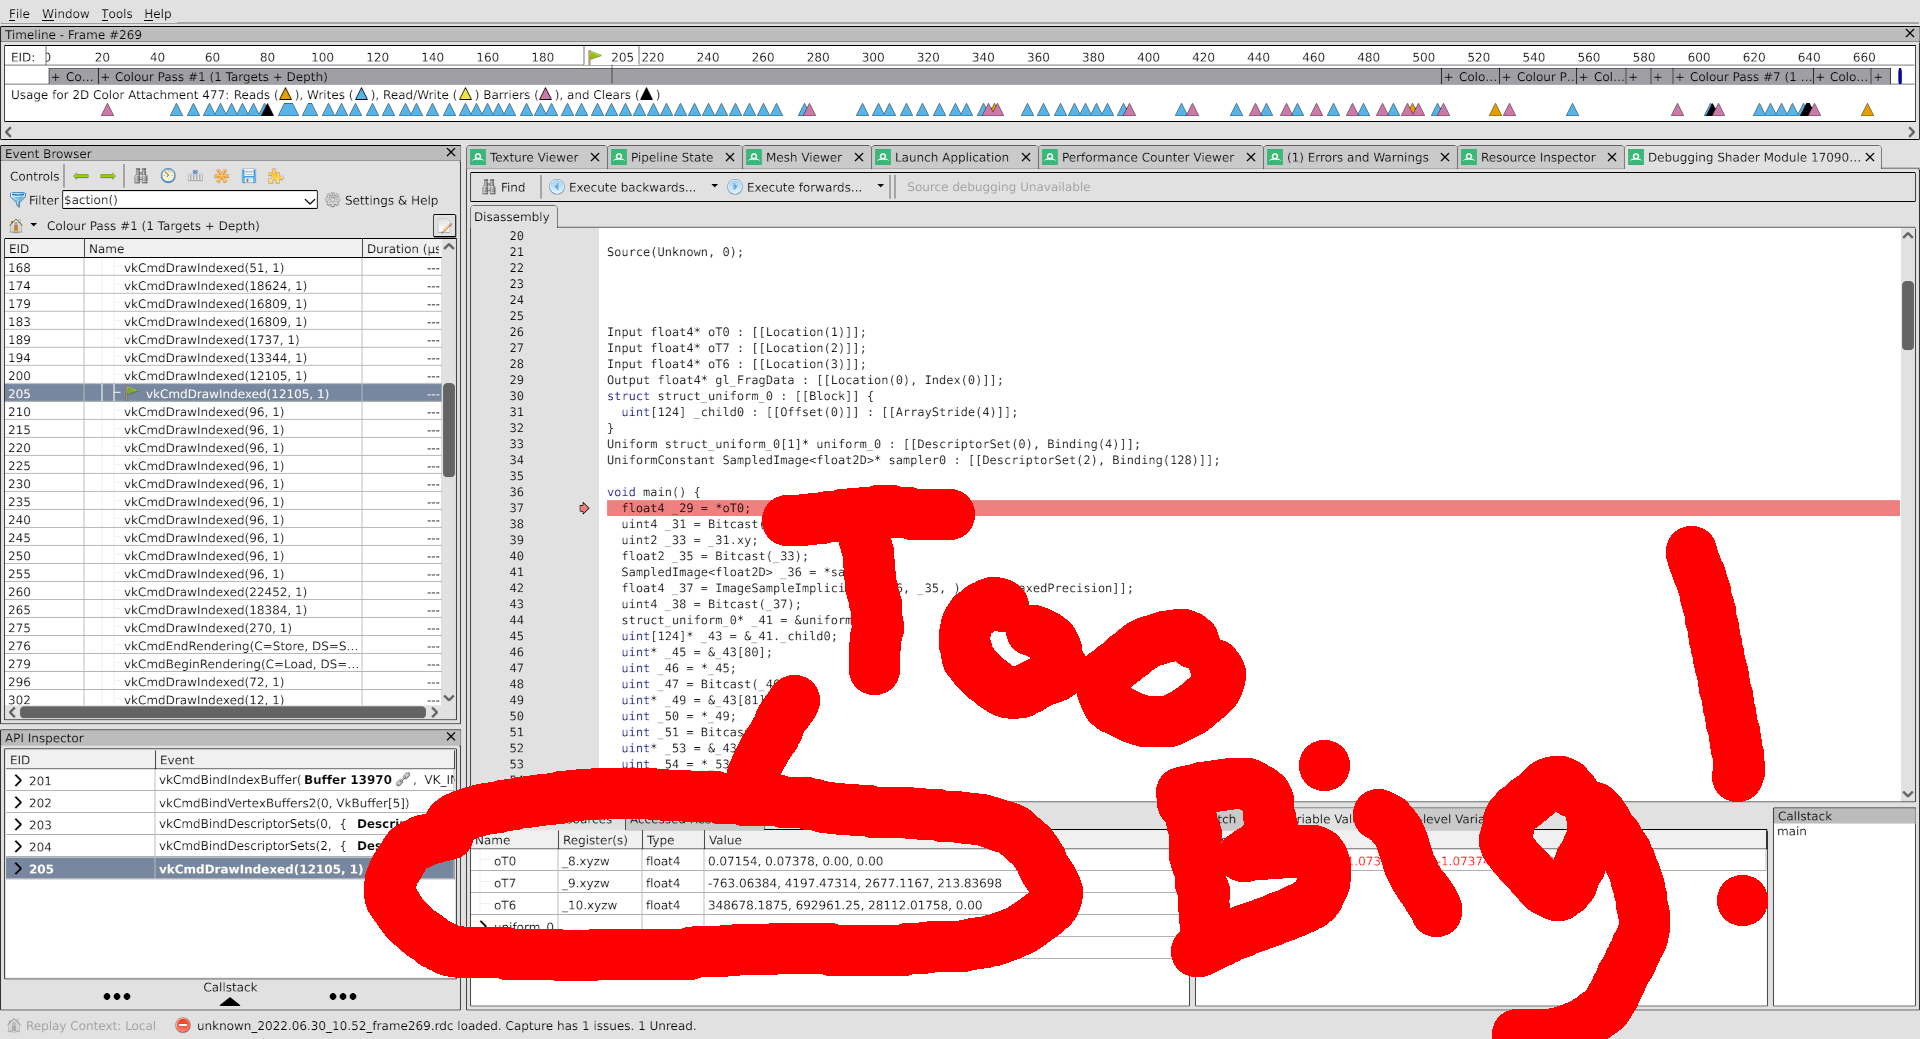
These vertex inputs are too big. Probably. I don’t have any proof that they’re not supposed to be non-normalized floats, but probably they aren’t, because who uses non-normalized floats?
Let’s open up the vertex shader by going to the pipeline inspector view, clicking the VS bubble, then clicking Edit → Decompile with SPIRV-Cross:
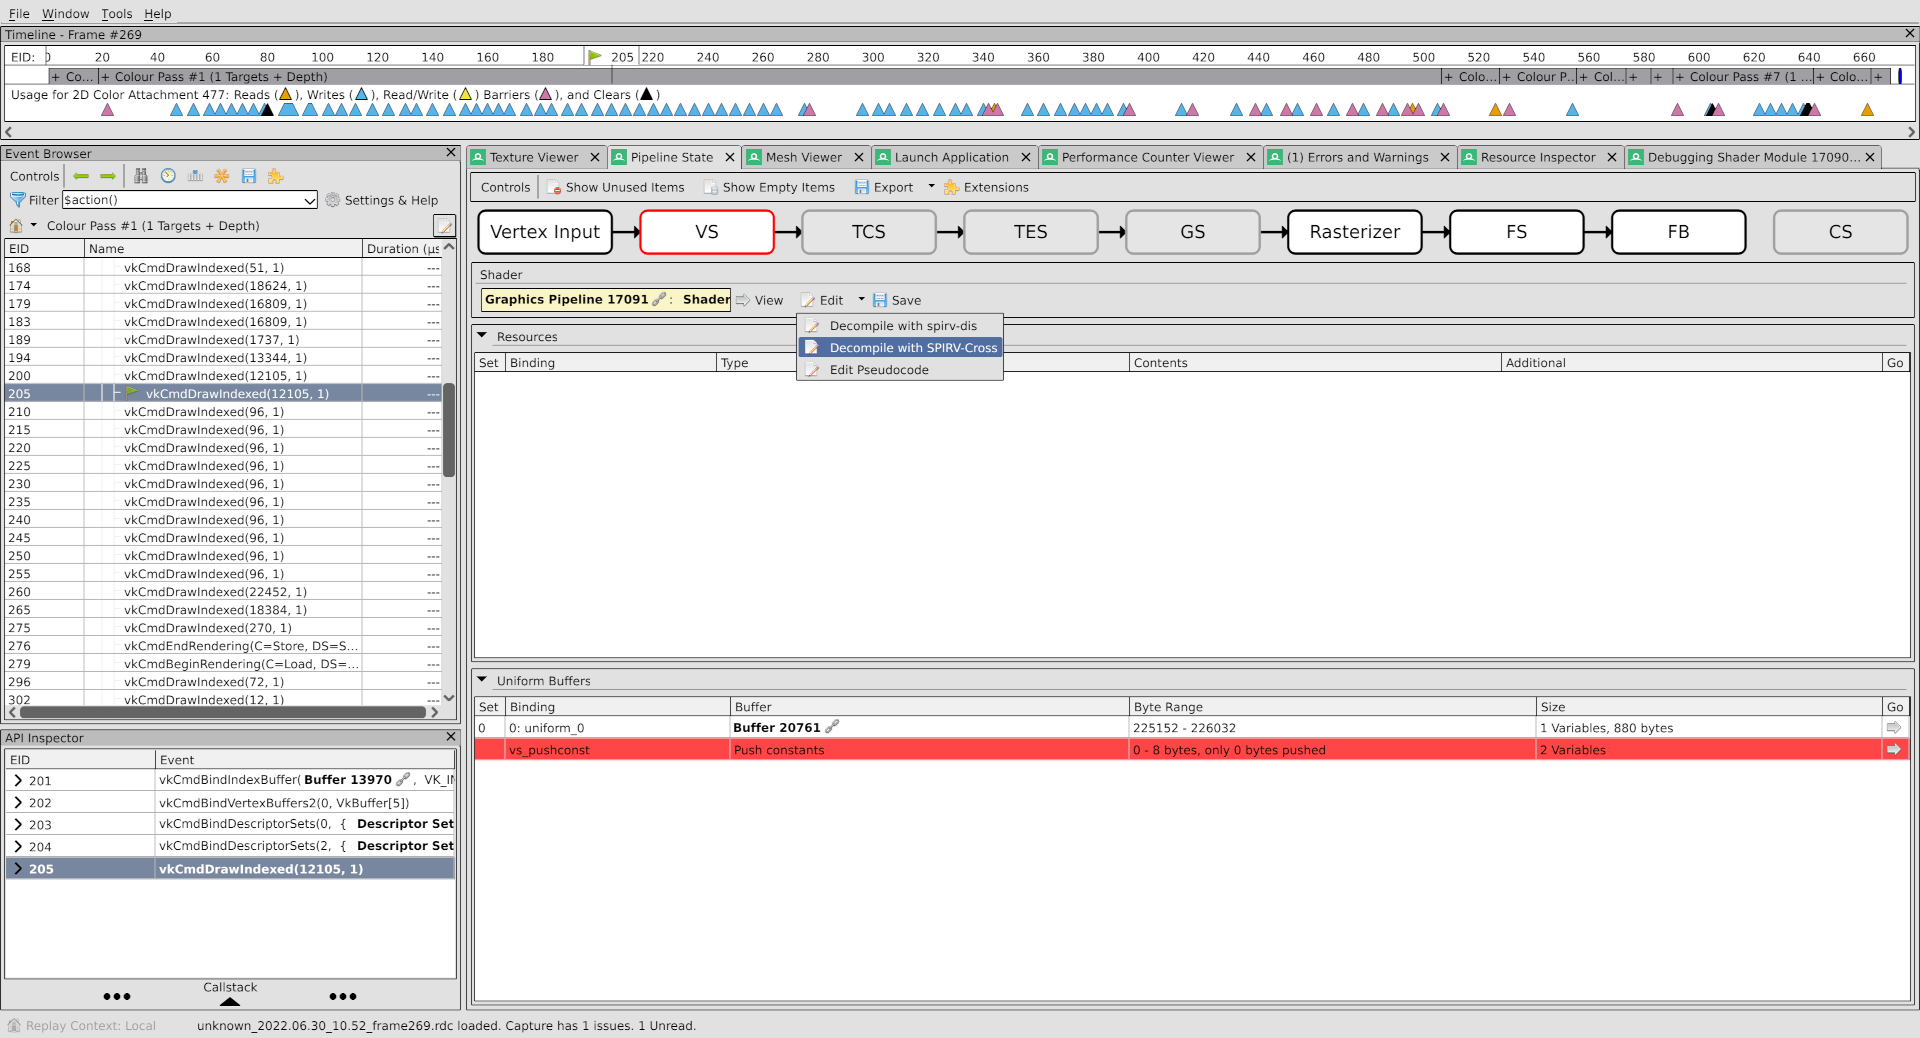
This brings up the vertex shader, decompiled back to GLSL for readability, where I’m interested to see the shader’s inputs and outputs:
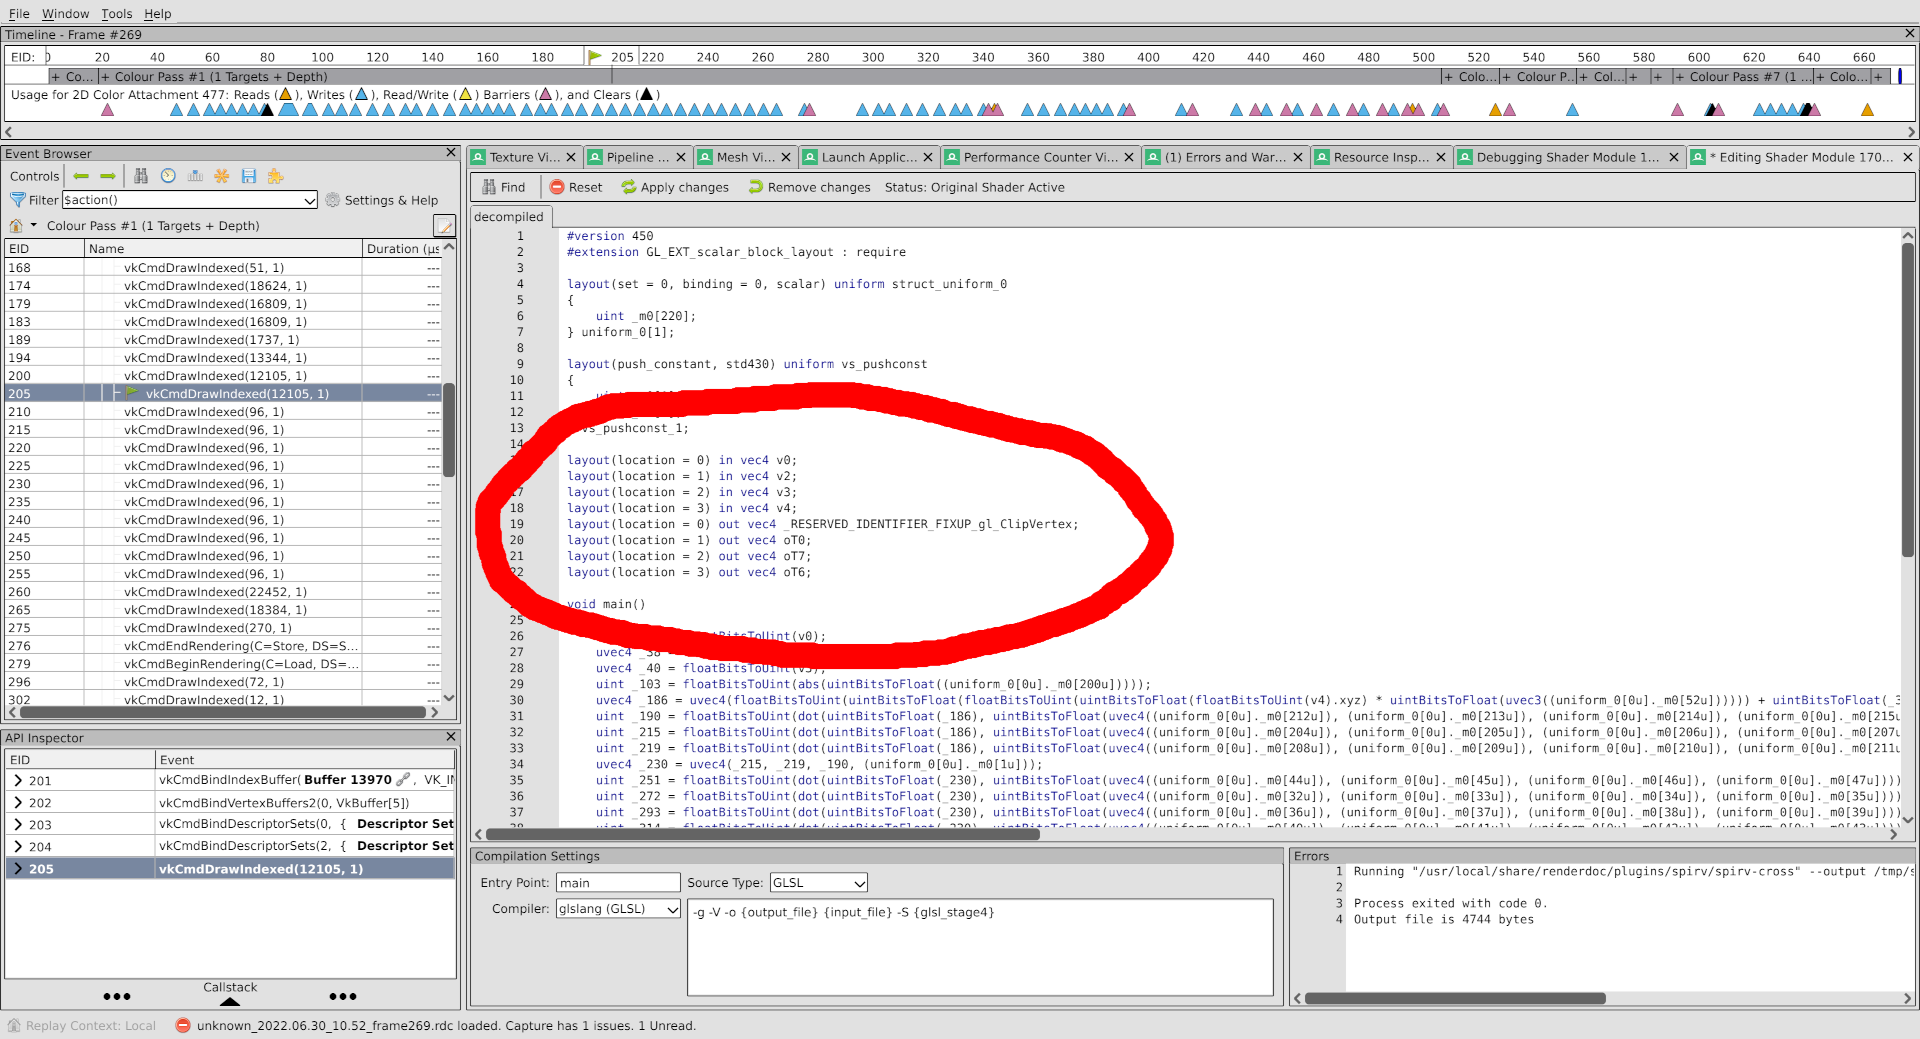
Happily, these are nicely organized such that there are 3 inputs and 3 outputs which match up with the fragment shader locations in the shader debugger from earlier, using locations 1, 2, 3. Having read through the shader, we see that each input location corresponds to the same output location. This means that broken vertex input data will yield broken vertex output data.
Here’s where the real Pro Gamer Move that I totally used at the time I was originally solving this issue comes into play. Notice that the input variables are named with a specific schema. v0 is location 0. v2, however, is location 1, v3 is location 2, and v4 is location 3.
Isn’t that weird?
We’re all experts here, so we can agree that it’s a little weird. The variables should probably be named v0, v1, v2, v3. That would make sense. I like things that make sense.
In this scenario, we have our R E F E R E N C E driver, Lavapipe, which has zero bugs and if you find them they’re your fault, so let’s look at the vertex shader in the same draw call there:
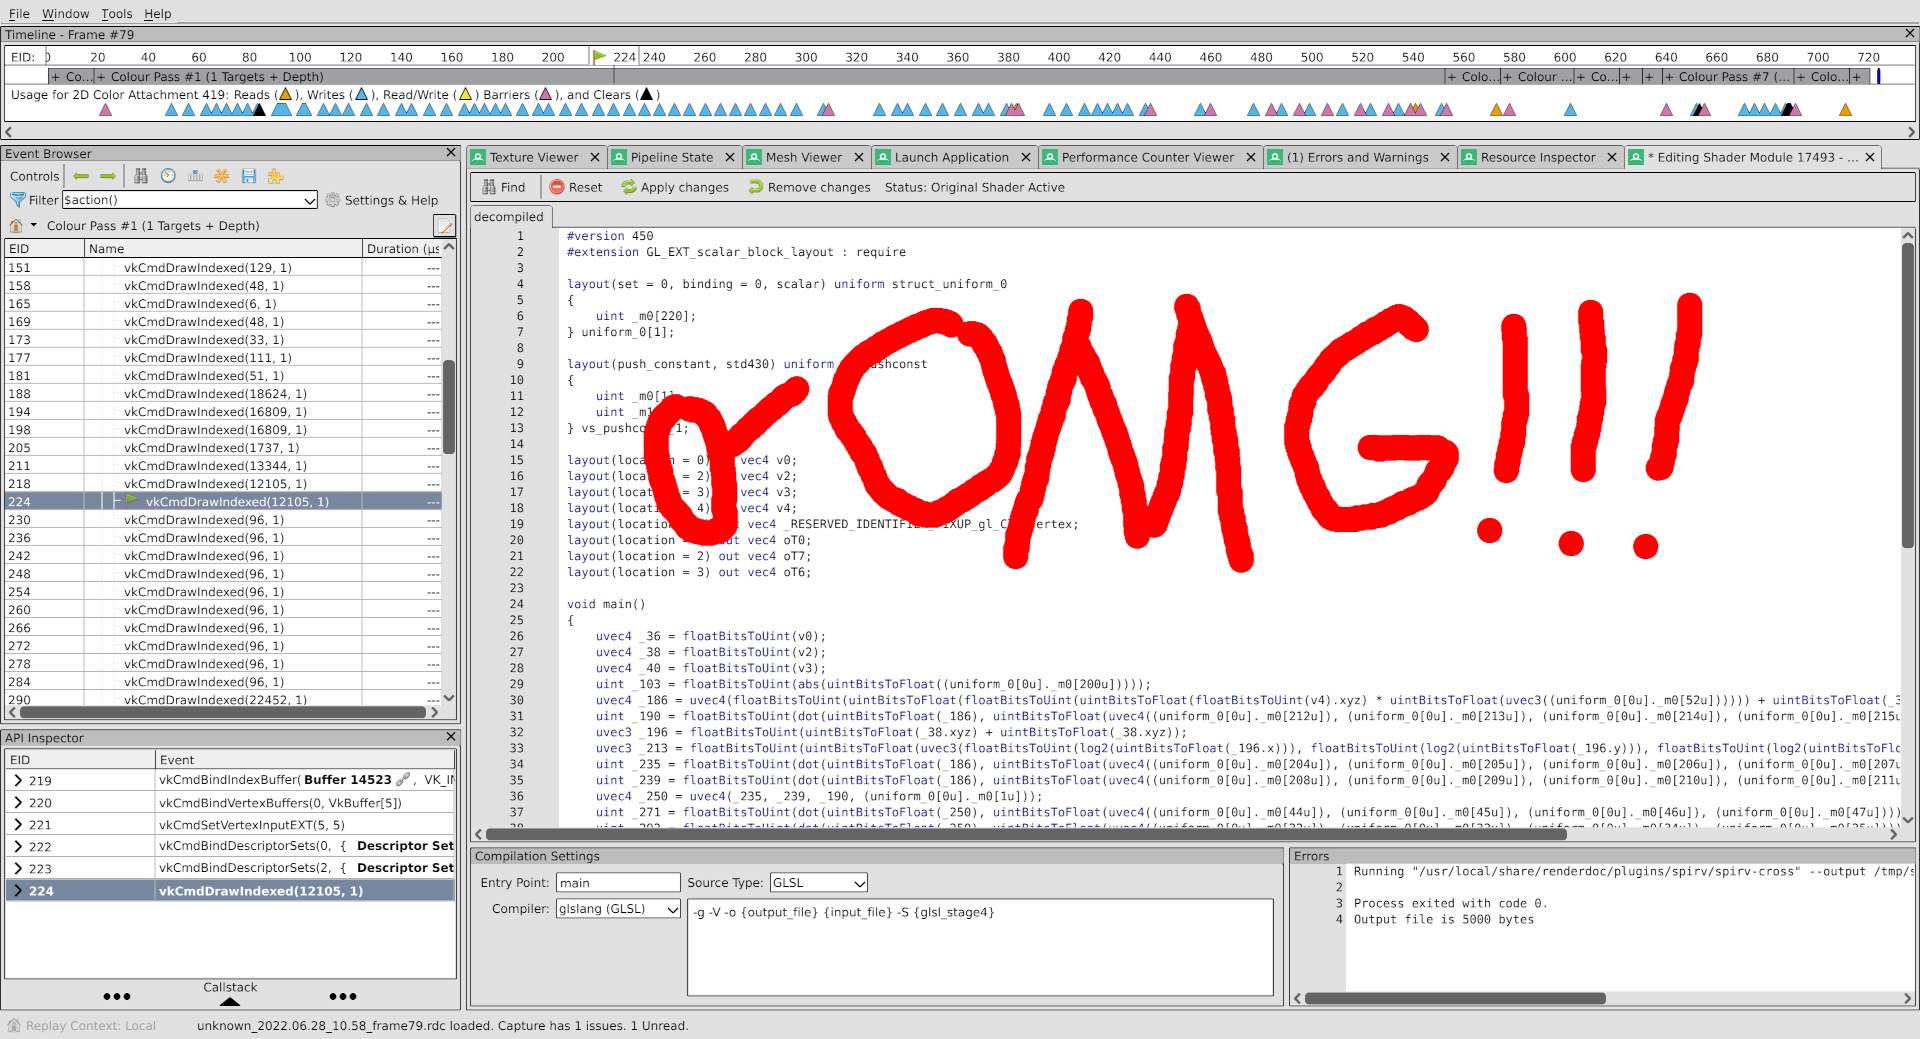
O
M
G
I was right. On my own blog. Nobody saw this coming.
So as we can see, in Lavapipe, where everything renders correctly, the locations do correspond to the variable names. Is this the problem?
Let’s find out.
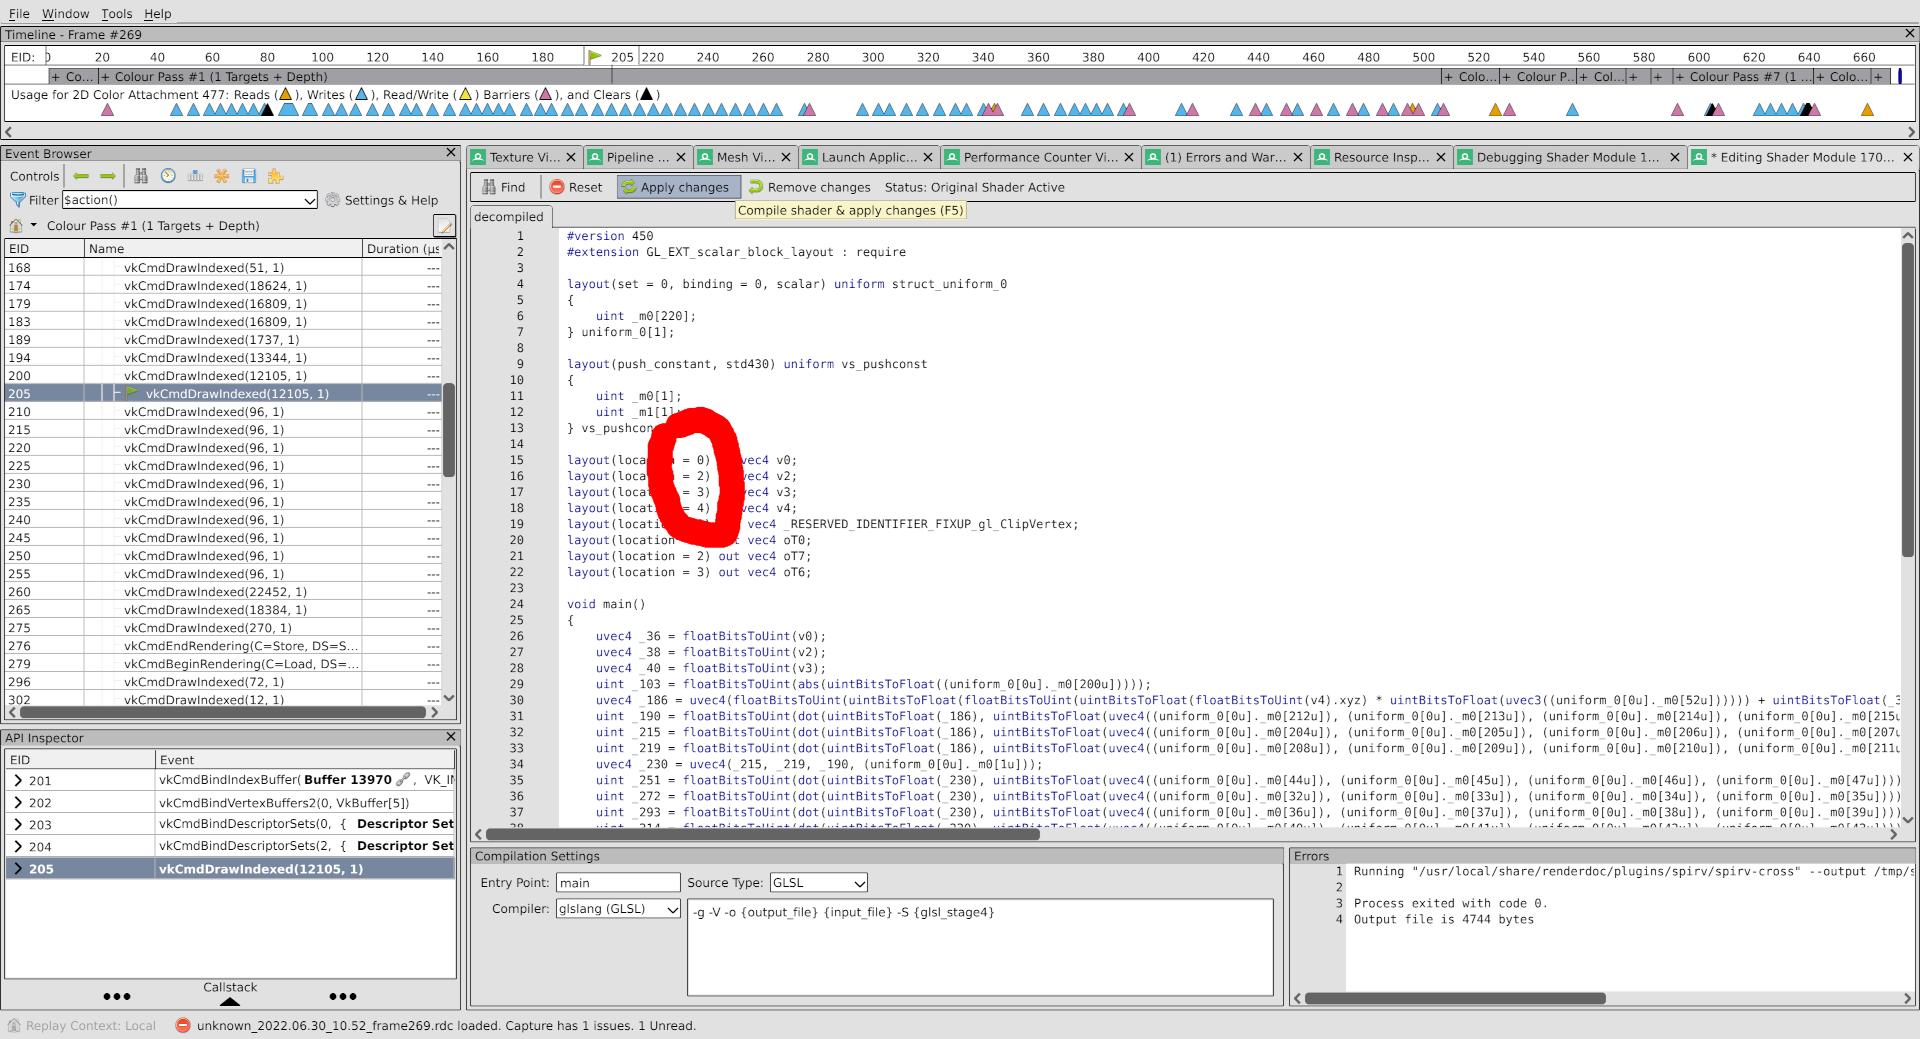
RenderDoc, being the futuristic piece of software that it is, lets us make changes like these and test them out.
Going back to the ANV capture and the vertex shader editing pane, I can change the locations in the shader and then compile and run it:
Which, upon switching to the texture viewer, yields this:
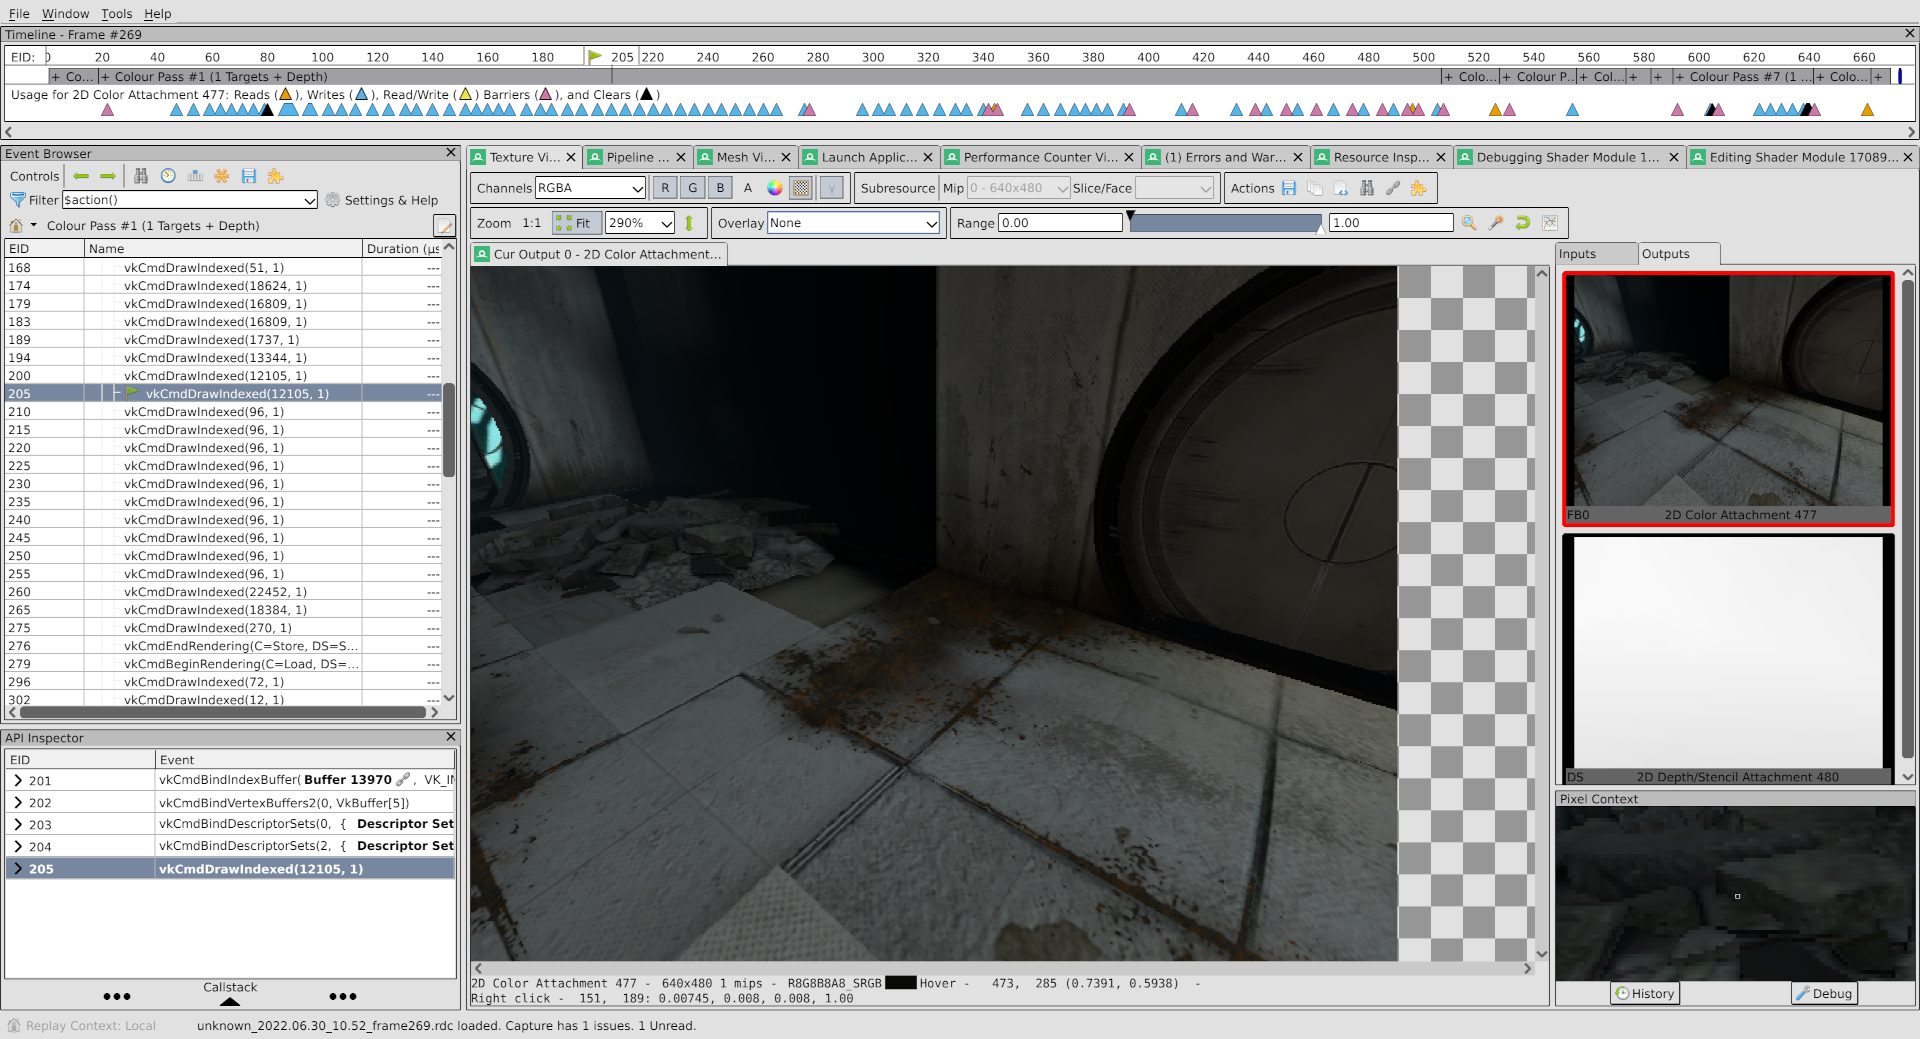
Hooray, it’s fixed. And if we switch back to the Vertex Input viewer in the pipeline inspector:
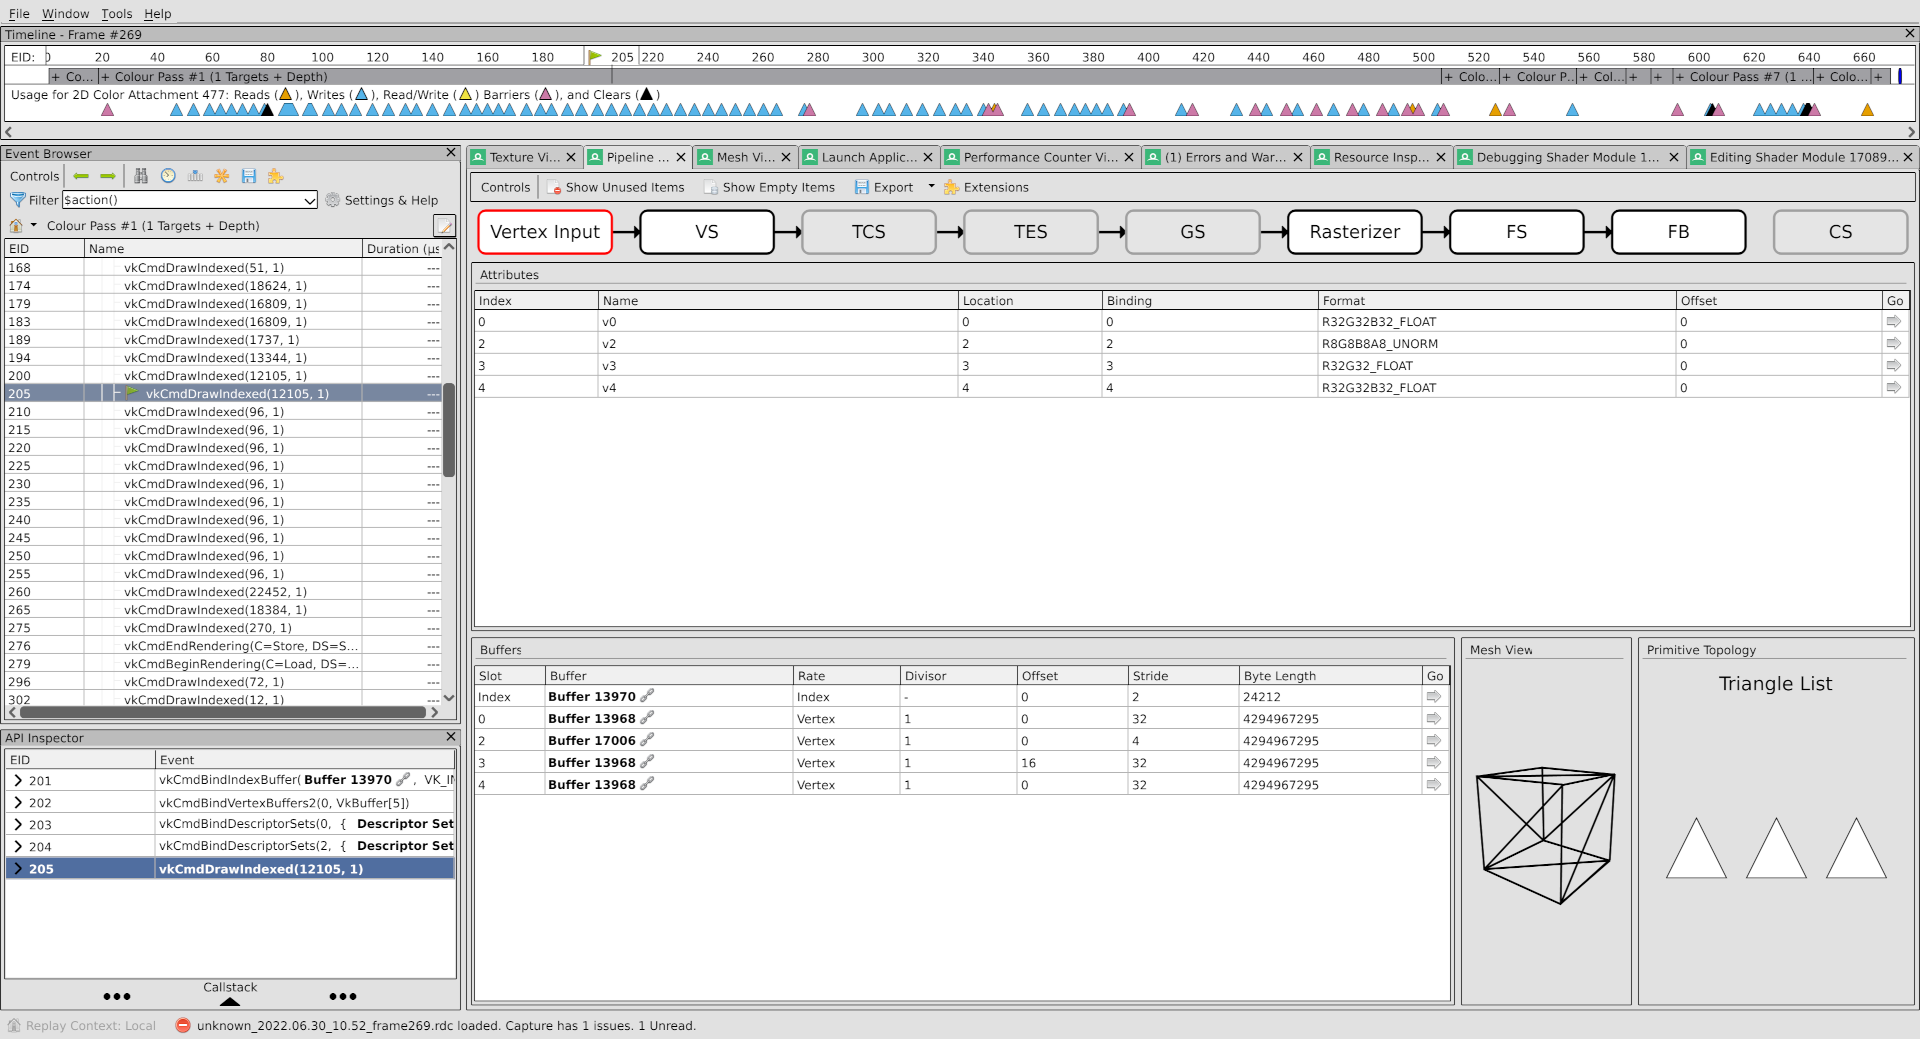
The formats here for the upper three attributes have also changed, which explains the problem. Also though there actually were non-normalized floats for some of the attributes, so my wild guess ended up only being partially right.
It wasn’t like I actually stepped through the whole fragment shader to see which inputs were broken and determined that oT6 in (broken) location 3 was coming into the shader with values far too large to ever produce a viable color output.
That would be way less cool than making a wild conjecture that happened to be right like a real guru would do.
Solutions
This identified the problem, but it didn’t solve it. Zink doesn’t do its own assignment for vertex input locations and instead uses whatever values Gallium assigns, so the bug had to be somewhere down the stack.
Given that the number of indices used in the draw call was somewhat unique, I was able to set a breakpoint to use with gdb, which let me:
- inspect the vertex shader to determine its id
- step through the process of compiling it
- discover that the location assignment problem was caused by a vertex attribute (
v1) that was deleted early on without reserving a location - determine that
v1should have reserved location 1, thus offsetting every subsequent vertex attribute by 1, which yields the correct rendering
And, like magic, I solved the issue.
But I didn’t fix it.
This isn’t a tutorial.
I’m just here so I don’t get fined.