The Last Bug
Release Work
As everyone is well aware, the Mesa 23.1 branchpoint is definitely going to be next week, and there is zero chance that it could ever be delayed*.
As everyone is also well aware, this is the release in which I’ve made unbreakable* promises about the viability of gaming on Zink.
Specifically, it will now be viable*.
But exactly one* bug remains as a blocker to that. Just one.
So naturally I had to fix it quick before anyone noticed*.
* Don’t @me for factual inconsistencies in any of the previous statements.
The Bug: Background
The thing about OpenGL games is a lot of them are x86 binaries, which means they run in a 32bit process. Any 32bit application gets 32bit address space. 32bit address space means a 4GiB limit on addressable memory. But what does that mean?
What is addressable memory? Addressable memory is any memory that can be accessed by a process. If malloc is called, this memory is addressable. If a file is mmaped, this memory is addressable. If GPU memory is mapped, this memory is addressable.
What happens if the limit is exceeded? Boom.
Why is the limit only 4GiB? Stop asking hard questions.
Why is this difficult? The issue from a driver perspective is that this limit includes both the addressable memory from the game (e.g., the game’s internal malloc calls) as well as the addressable memory from the driver (e.g., all the GPU mapped memory). Thus, while I would like to have all 4GiB (or more, really; doesn’t everyone have 32GiB RAM in their device these days?) to use with Zink, I do not have that luxury.
The Bug: How Bad Is It?
Judging by recent bug reports and the prevalance on 32bit games, it’s pretty bad. Given that I solved GPU map VA leaking a long time ago, the culprit must be memory utilization in the driver. Let’s check out some profiling.
The process for this is simple: capture a (long) trace from a game and then run it through massif. Sound familiar?
The game in this case is, of course, Tomb Raider (2013), the home of our triangle princess. Starting a new game runs through a lot of intro cinematics and loads a lot of assets, and the memory usage is explosive. See what I did there? Yeah, jokes. On a Monday. Whew I need a vacation.
This is where I started:
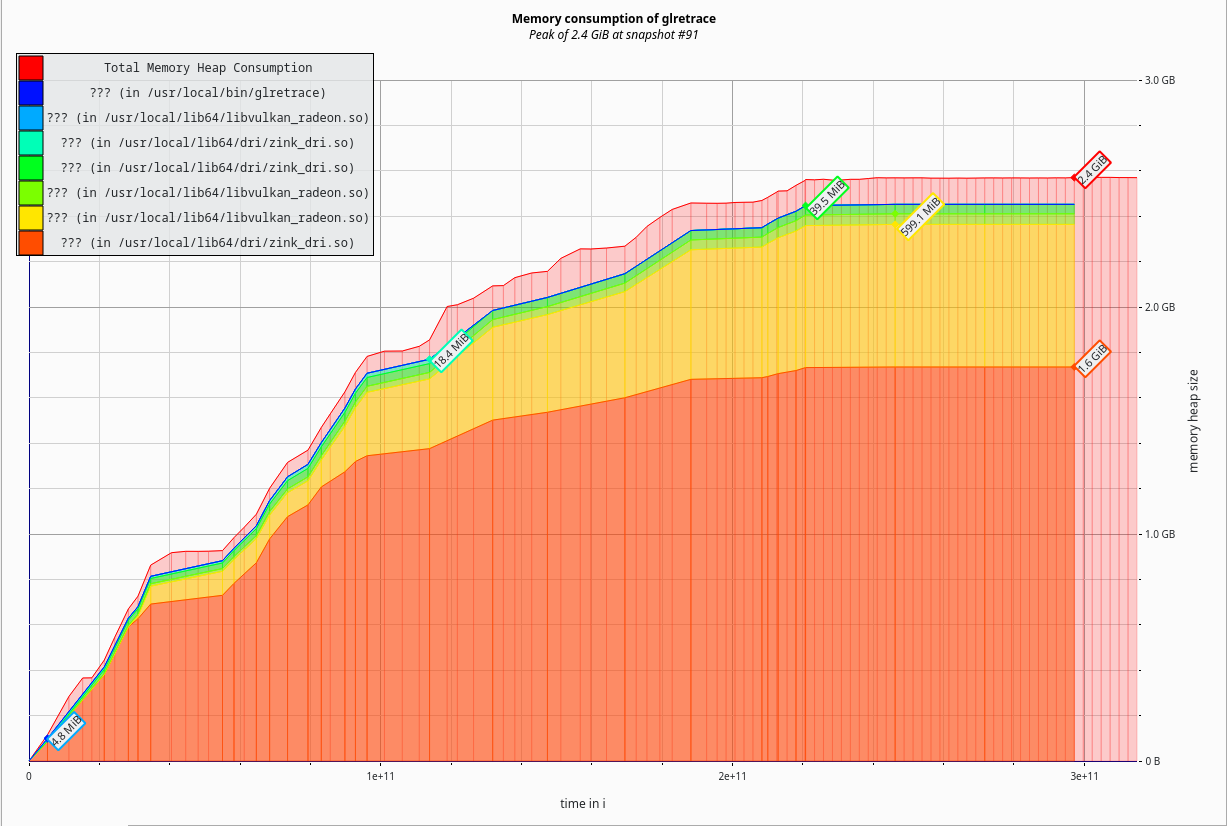
2.4 GiB memory allocated by the driver. In a modern, 64bit process, where we can make full use of the 64GiB memory in the device, this is not a problem and we can pretend to be a web browser using this much for a single tab. But here, from an era when memory management was important and everyone didn’t have 128GiB memory available, that’s not going to fly.
Hm 🤔
Initial analysis yielded the following pattern:
n3: 112105776 0x5F88B73: nir_intrinsic_instr_create (nir.c:759)
n1: 47129360 0x5F96216: clone_intrinsic (nir_clone.c:358)
n1: 47129360 0x5F9692E: clone_instr (nir_clone.c:496)
n1: 47129360 0x5F96BB4: clone_block (nir_clone.c:563)
n2: 47129360 0x5F96DEE: clone_cf_list (nir_clone.c:617)
n1: 46441568 0x5F971CE: clone_function_impl (nir_clone.c:701)
n3: 46441568 0x5F974A4: nir_shader_clone (nir_clone.c:774)
n1: 28591984 0x67D9DE5: zink_shader_compile_separate (zink_compiler.c:3280)
n1: 28591984 0x69005F8: precompile_separate_shader_job (zink_program.c:2022)
n1: 28591984 0x57647B7: util_queue_thread_func (u_queue.c:309)
n1: 28591984 0x57CD7BC: impl_thrd_routine (threads_posix.c:67)
n1: 28591984 0x4DDB14C: start_thread (in /usr/lib64/libc.so.6)
n0: 28591984 0x4E5BBB3: clone (in /usr/lib64/libc.so.6)
Looking at the code, I found an obvious issue: when I implemented precompile for separate shaders a month or two ago, I had a teensie weensie little bug. Turns out when memory is allocated, it has to be freed or else it becomes unreachable.
This is commonly called a leak.
It wasn’t caught before now because it only affects Tomb Raider and a handful of unit tests.
But I caught it, and it was so minor that I already (“quietly”) landed the fix without anyone noticing.
This sort of thing will be fixed when zink is rewritten in Rust*.
Hm. 🤔🤔
With an actual bug fixed, what does memory utilization look like now?
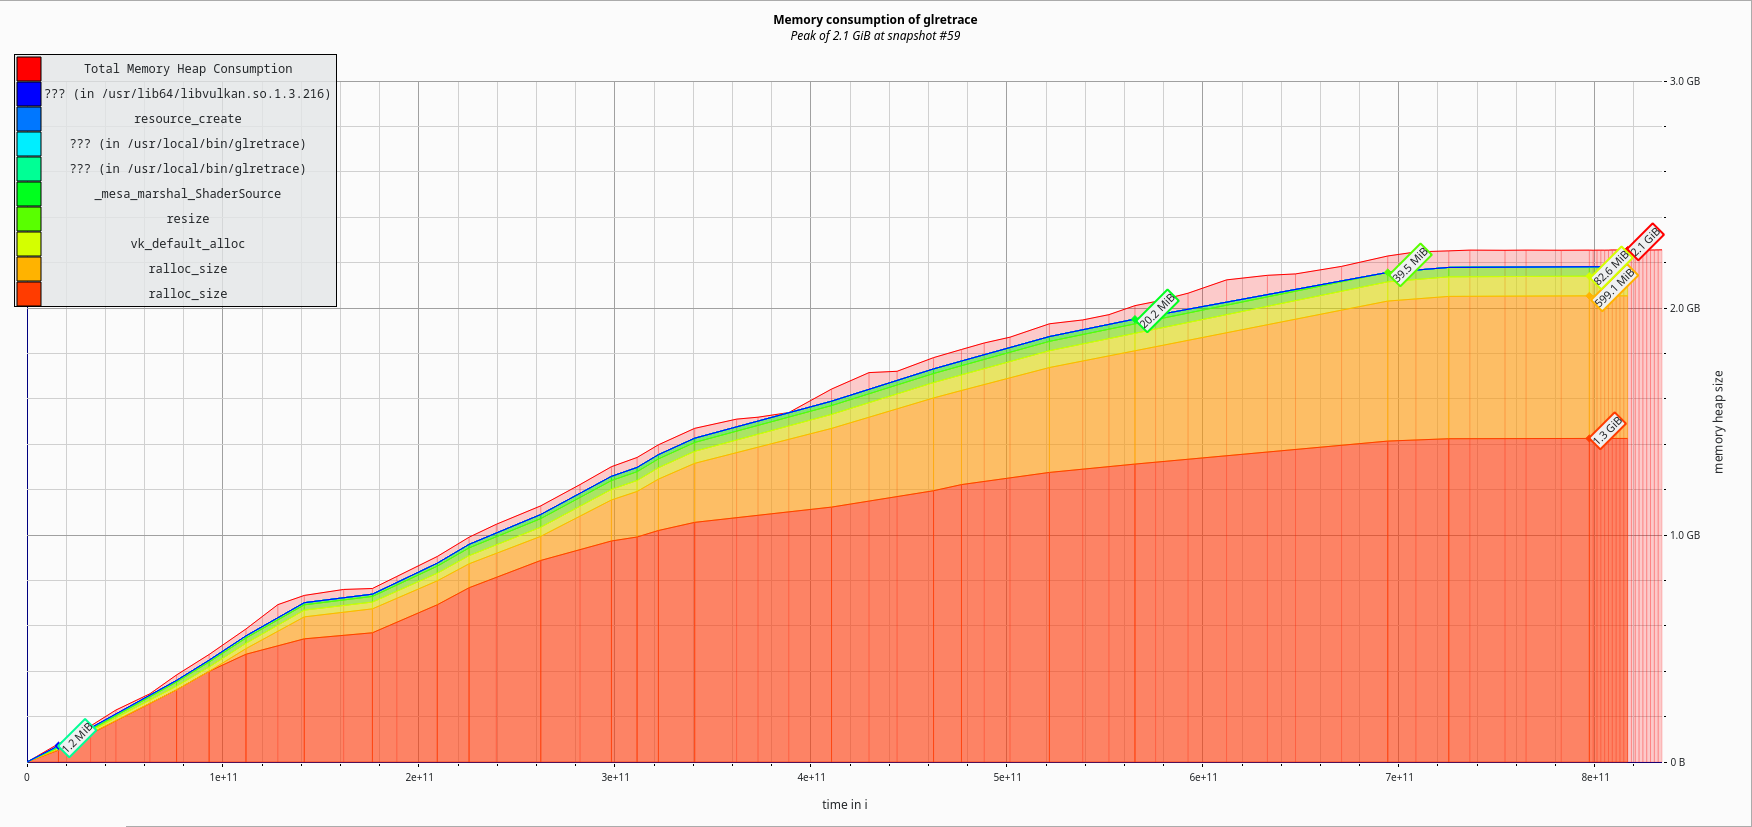
Down 300MiB to 2.1GiB. A 12.5% reduction. Not that exciting.
Certainly nothing that would warrant a SGC blog post.
My readers have standards.

Time to expand some expandables.
Here’s another common pattern in the massif output:
n4: 317700704 0x57570DA: ralloc_size (ralloc.c:117)
n1: 226637184 0x57583BB: create_slab (ralloc.c:759)
n3: 226637184 0x5758579: gc_alloc_size (ralloc.c:789)
n6: 215583536 0x575868C: gc_zalloc_size (ralloc.c:814)
n7: 91059504 0x5F88CE6: nir_alu_instr_create (nir.c:696)
n4: 35399104 0x5F90C49: nir_build_alu2 (nir_builder.c:162)
n0: 12115376 in 29 places, all below massif's threshold (1.00%)
n1: 11690848 0x67C90F1: nir_iadd (nir_builder_opcodes.h:1309)
n2: 11690848 0x67CB493: nir_iadd_imm (nir_builder.h:719)
n1: 6074016 0x67D691C: remove_bo_access_instr (zink_compiler.c:2013)
n1: 6074016 0x67C89A9: nir_shader_instructions_pass (nir_builder.h:88)
n1: 6074016 0x67D6DB2: remove_bo_access (zink_compiler.c:2044)
n1: 6074016 0x67E4827: zink_shader_create (zink_compiler.c:4409)
n1: 6074016 0x690443E: zink_create_gfx_shader_state (zink_program.c:1885)
n1: 6074016 0x623484B: util_live_shader_cache_get (u_live_shader_cache.c:141)
n1: 6074016 0x69044CC: zink_create_cached_shader_state (zink_program.c:1900)
This is some ralloc usage from zink’s shader creation. In short, the in-memory shader IR is…
Hold on. Doesn’t this sound familiar?
It turns out that nothing is ever new, and all problems have been solved before. By applying the exact same solution, we’re gonna start to see some big movement in these numbers.
Serializing
Serialized NIR is much more compact than object-form NIR. The memory footprint is an order of magnitude smaller, which begs the question why would anyone ever store NIR structs in memory.
I don’t have an answer. One might try to make the argument that it makes shader variant creation easier, but then, it also needs to be said that shader variants require the NIR to be cloned anyway, which deserialization already (functionally) does. There’s shader_info, but that’s small, unchanging, and can be easily copied. I think it’s just convenience. And that’s fine.
But it’s not fine for me or zink.
Thus, I began converting all the NIR objects I was keeping around (and there’s lots) to serialized form. The first task was tackling zink_shader::nir, the object that exists for every shader created in the driver. How much would this help?
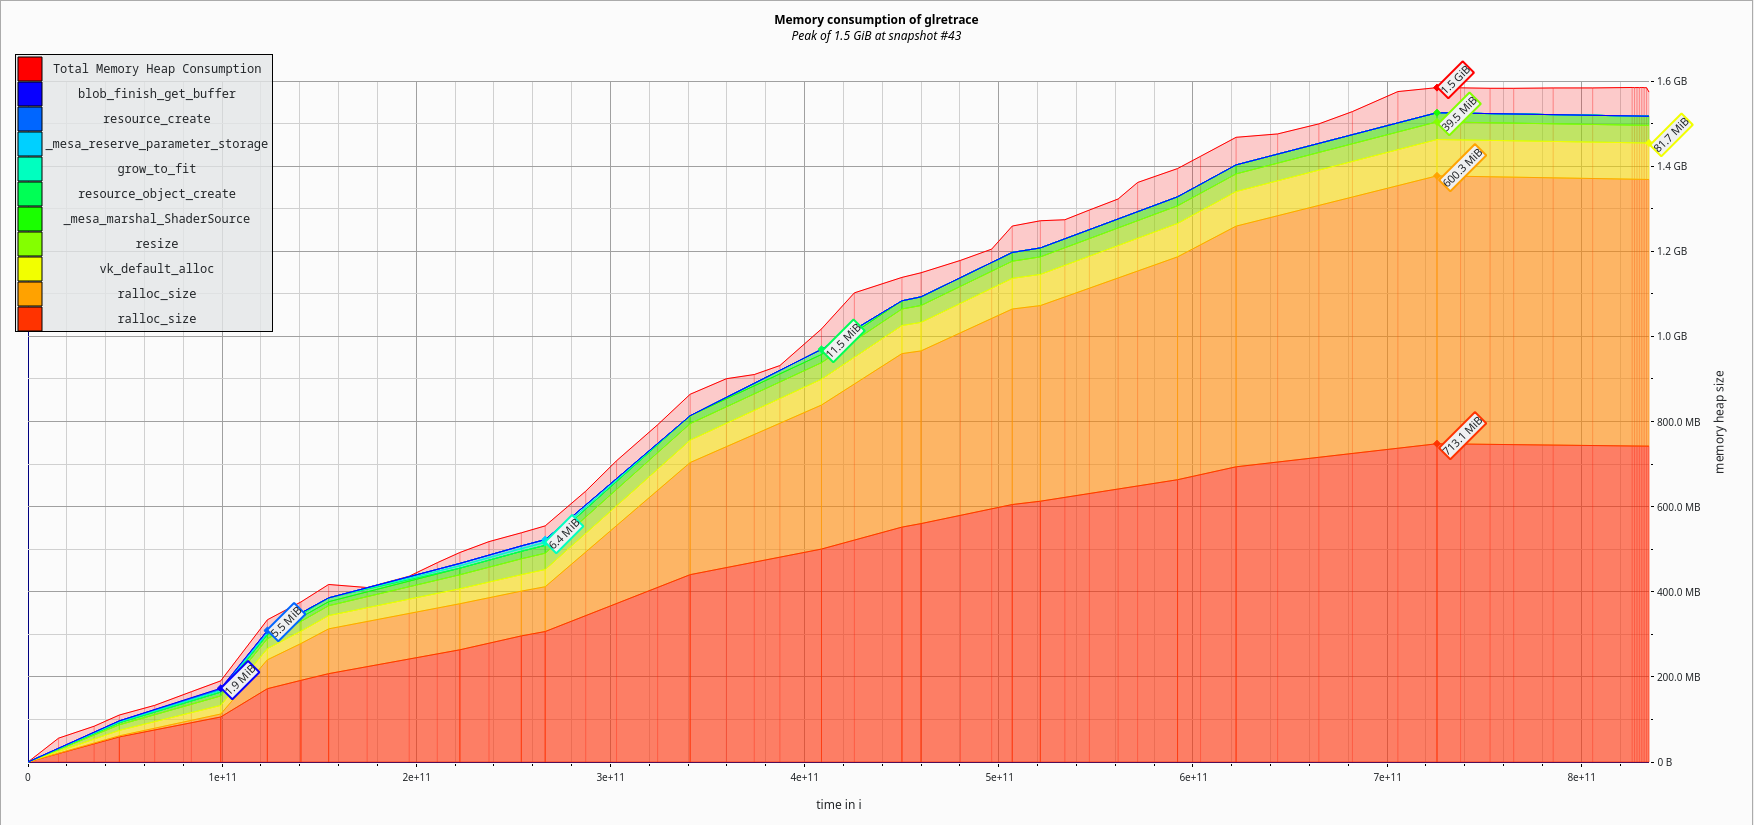
Down another 500MiB to 1.6GiB total. That’s another 24% reduction.

Now we’re getting somewhere.
But again, SGC enthusiasts have standards, and a simple 33% improvement from where things started is hardly worth mentioning here, so I apologize for wasting time.
Continuing, it’s easy to keep finding these patterns:
n1: 64055264 0x57583BB: create_slab (ralloc.c:759)
n2: 64055264 0x5758579: gc_alloc_size (ralloc.c:789)
n6: 61664176 0x575868C: gc_zalloc_size (ralloc.c:814)
n2: 22299104 0x5F88CE6: nir_alu_instr_create (nir.c:696)
n1: 19814432 0x60B3804: read_alu (nir_serialize.c:905)
n1: 19814432 0x60B6713: read_instr (nir_serialize.c:1787)
n1: 19814432 0x60B69BD: read_block (nir_serialize.c:1856)
n1: 19814432 0x60B6D6A: read_cf_node (nir_serialize.c:1949)
n2: 19814432 0x60B6EA0: read_cf_list (nir_serialize.c:1976)
n1: 19195888 0x60B708A: read_function_impl (nir_serialize.c:2012)
n1: 19195888 0x60B7C2A: nir_deserialize (nir_serialize.c:2219)
n2: 19195888 0x67E754A: zink_shader_deserialize (zink_compiler.c:4820)
n2: 19195888 0x6901899: zink_create_gfx_program (zink_program.c:1041)
n1: 17921504 0x6901C6C: create_linked_separable_job (zink_program.c:1105)
n1: 17921504 0x57647B7: util_queue_thread_func (u_queue.c:309)
n1: 17921504 0x57CD7BC: impl_thrd_routine (threads_posix.c:67)
n1: 17921504 0x4DDB14C: start_thread (in /usr/lib64/libc.so.6)
n0: 17921504 0x4E5BBB3: clone (in /usr/lib64/libc.so.6)
This one is from the NIR copy that happens when linking shaders. Simple enough to compress.
New graph:
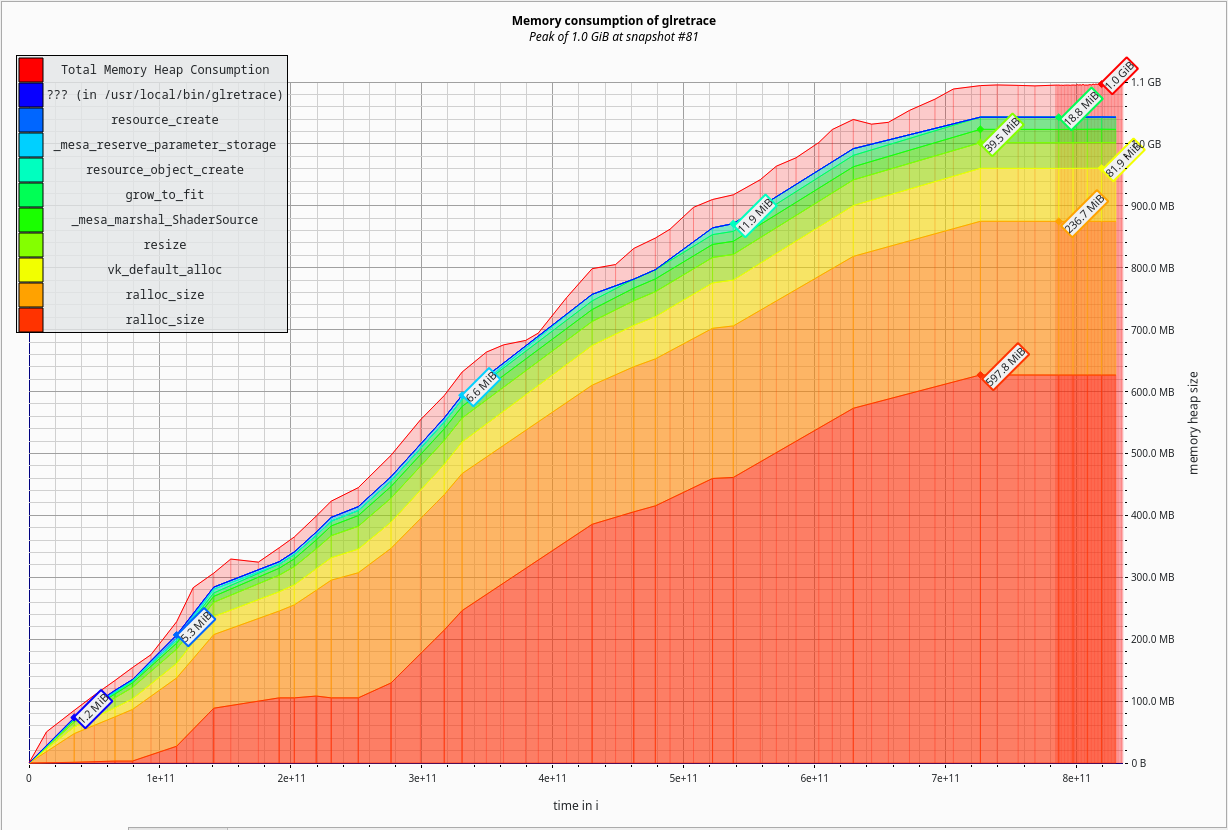
An additional 37.5% reduction to 1.0GiB? That’s not too shabby. Now we’re looking at an overall 58% reduction in memory utilization. This is the kind of improvement that SGC readers have come to expect.
S 🚀 A 🚀 M 🚀 U 🚀 E 🚀 L
But wait! I was doing all this last week. And the start of this post was a really long time ago, but wasn’t there something else causing high memory utilization last week?
That’s right, these graphs are still being hit by the now-fixed RADV shader IR ballooning.
What hap

What happens if I apply that fix too?
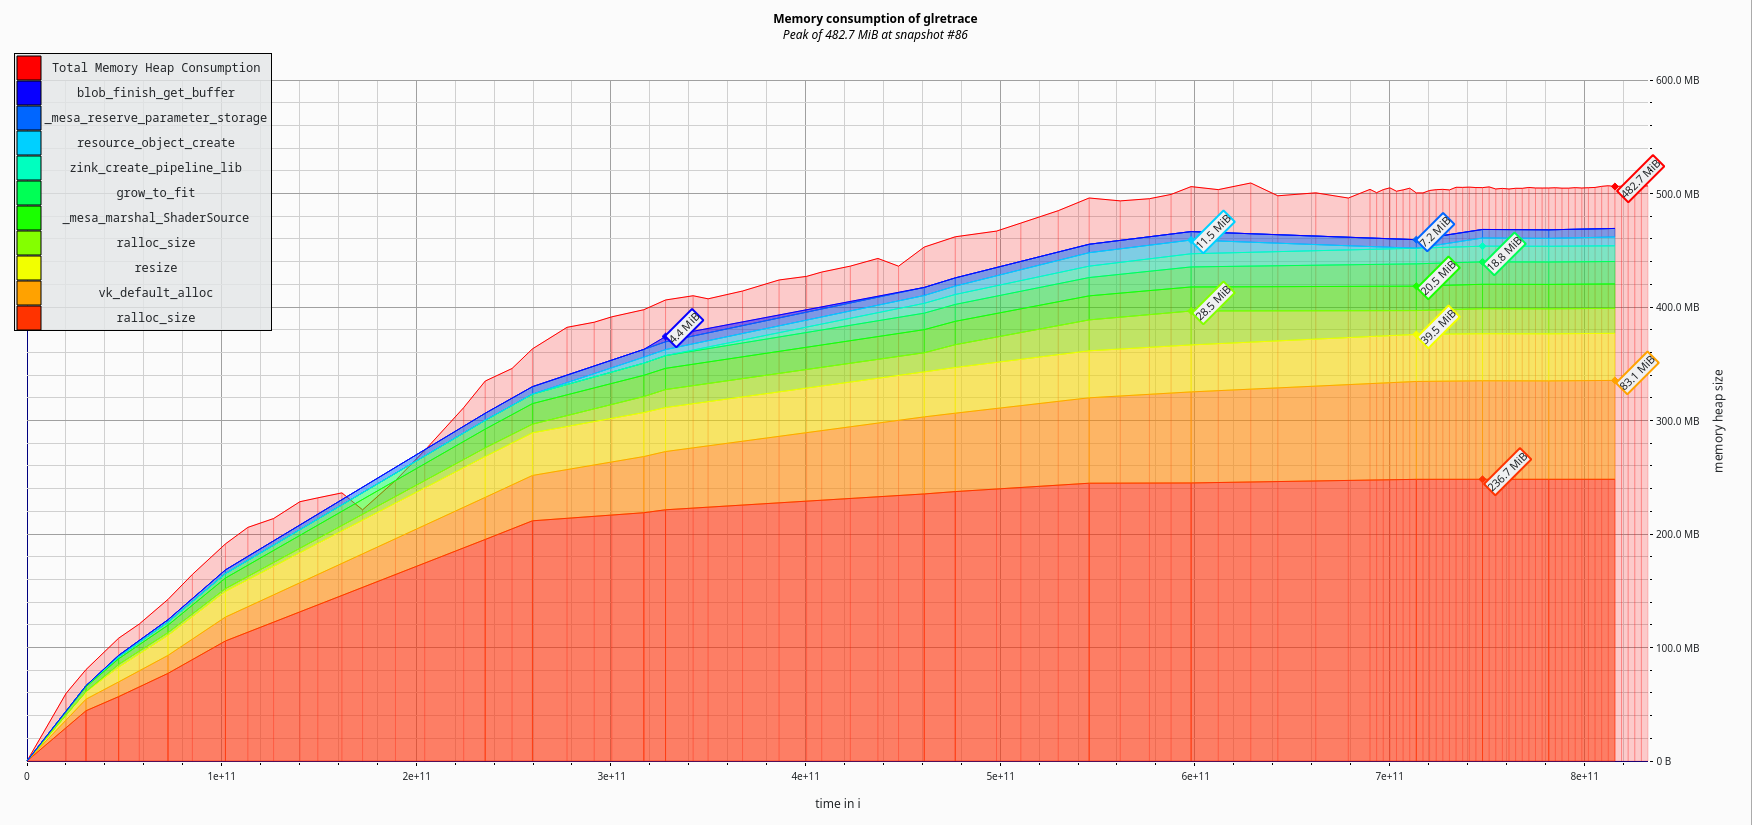
482.7MiB total memory usage.
That’s another 51.7% improvement.
Overall a 79.9% reduction in memory usage. I’d expect similar (or greater?) savings for all games.
The MR is up now, and I expect it should be merged soon™.
Q&A
Doesn’t this negatively affect performance?
No.
But doesn’t using more memory improve performance?
No.
What will I do with the rest of my 256GiB RAM?
Open two more browser tabs.